QInsights offers sentiment analysis for semi-structured data in Excel format - ideal for open-ended survey responses, customer feedback, or social media comments. For Word or PDF documents, you can run an equivalent analysis through a prompt in Conversational Analysis (template below).
Traditional sentiment analysis sorts feedback into positive, neutral, or negative. With generative AI, it becomes more dynamic: you define custom dimensions that fit your data - "satisfied" vs. "dissatisfied," "rational" vs. "emotional" - and can narrow the scope to a specific topic and refine results interactively through follow-up questions.
How it works
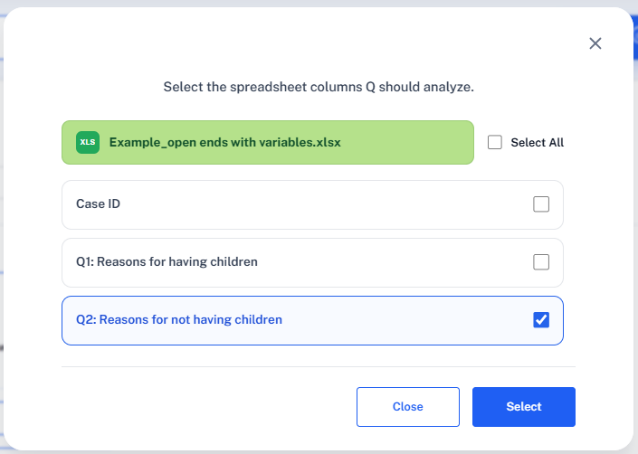
1. Select your data
Choose an Excel file, select the column to analyze - sentiment analysis evaluates data case by case, row by row - and choose Sentiment Analysis.
2. Define sentiment categories
Use standard categories (positive / neutral / negative) or define your own - for example satisfied, neutral, dissatisfied; rational, emotional; planned, impulsive; supportive, critical, neutral.
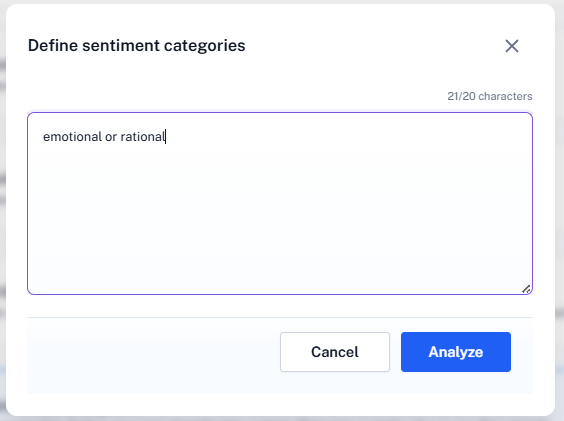
You can also narrow the scope to a specific topic - for example, "Classify responses that directly refer to the post's content as like, neutral, or dislike" for social media data, or "Disappointment or satisfaction with regard to usability" for customer feedback.
3. Review results
QInsights produces a pie chart showing the distribution across your defined dimensions - hover to see percentages - plus a written summary from Q below the chart.
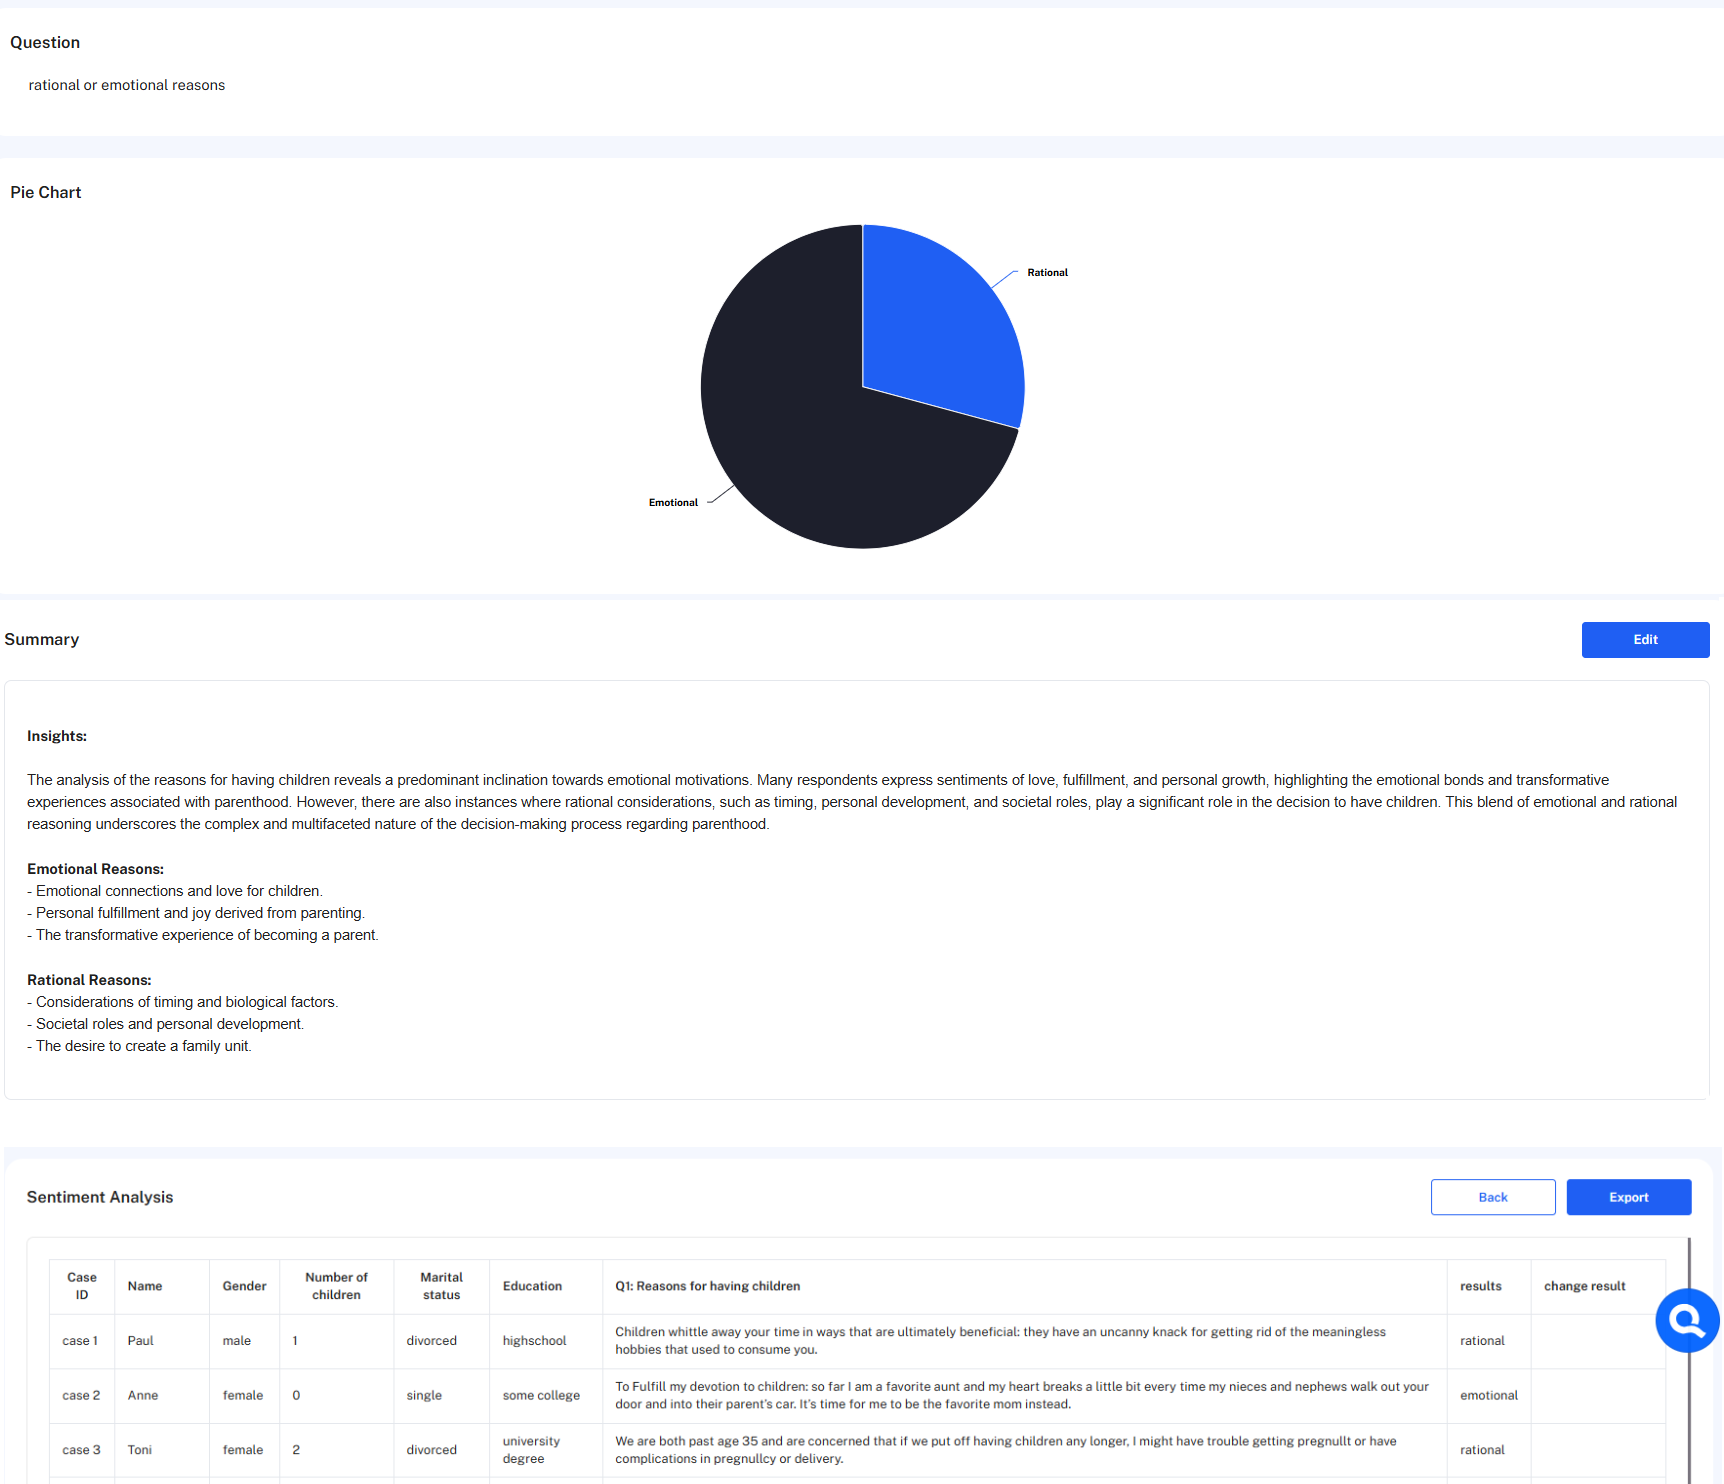
Export the detailed, case-by-case evaluation as an Excel file for further review or reporting. Ask follow-up questions to go deeper - for example:
- "List all dimensions with their percentage distribution."
- "Check all rational reasons for similarity, group similar reasons under a category with a name and description, and provide example quotes."
Best practices
- Focus on one column at a time. If your dataset has separate questions for "benefits" and "challenges," analyze them separately to avoid conflicting results.
- Keep prompts simple. Prefer straightforward dimensions ("rational vs. emotional regarding product design") over stacked, multi-layered instructions ("group responses by similarity, then analyze for rational vs. emotional reasons"). Overly complex prompts tend to produce pie charts with dozens of thin, hard-to-read slices - simplify the prompt if that happens.
- Tailor dimensions to your data. Examples: happy, frustrated for customer feedback; supportive, critical, neutral for policy responses; disappointed, neutral, excited for product feedback.
- Reuse an established framework. If you're working with a predefined set of dimensions and their definitions, add them (with descriptions) to the project description - Q will take those definitions into account whenever you reference the dimensions in analysis.
Sentiment analysis for Word or PDF documents
Use a prompt like the one below in Conversational Analysis to run an equivalent sentiment analysis on interview, focus group, or report text. Refine it to fit your needs.
For each document, classify sentiments at a reasonably granular level (by paragraph, speaker turn, or thematic section) into positive, negative, or neutral categories (or define other dimensions that better suit your analysis purpose).
Document-level summary: describe the overall balance of sentiments and cite short quotes or examples that illustrate each.
Cross-document analysis: summarize common themes or patterns in sentiment across all documents, and identify significant outliers, contradictions, or unexpected expressions.
Relative weighting (instead of counts): for each document, indicate whether positive, negative, or neutral sentiments are dominant, secondary, or minor; for the full set, summarize the relative distribution.
Output format: a per-document analysis (title, sentiment balance, representative quotes, brief summary) followed by a cross-document summary (overall balance, overarching themes, conflicting or surprising findings).
Next steps
For deeper exploration of specific respondent groups, continue in a follow-up chat, or see Filters to narrow the dataset before running the analysis.