Data Context defines how QInsights should understand and organize your data before analysis. It lets you assign speaker roles, create characteristics for speakers or documents, and enter the corresponding values.
Adding context improves analysis quality: it helps QInsights distinguish evidence from framing, interpret responses in relation to speaker or document characteristics, and support comparisons across groups or data sources. It's particularly useful when you:
- work with interviews or focus groups involving multiple speakers
- want to compare responses across participant groups
- analyze mixed datasets from different sources
- work with larger datasets and need structured filtering
Define speaker roles
For interview and focus group data, assigning the correct role to each speaker matters: contributions from respondents are treated as analytic evidence and can be quoted, while contributions from interviewers or moderators are treated as contextual material that frames the conversation but isn't analyzed as data.
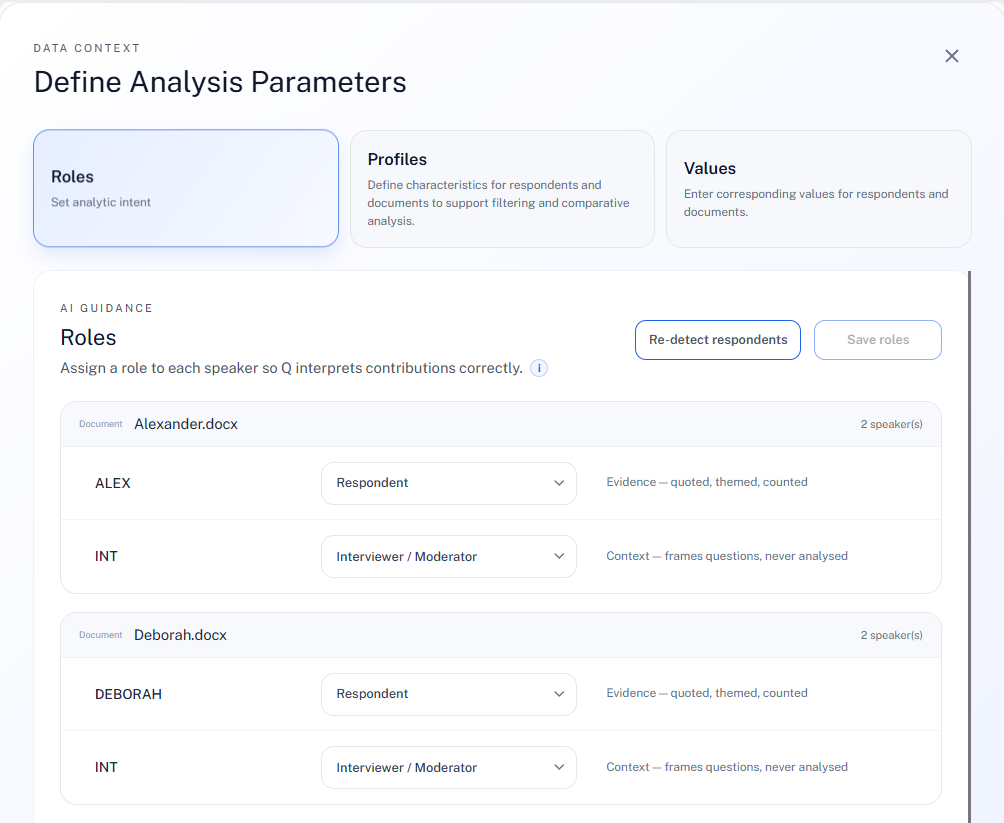
Three roles are available:
- Respondent - the speaker's text is treated as primary data: quoted, themed, and counted.
- Interviewer / Moderator - retained as context that frames questions, but never analyzed as data.
- Exclude - the speaker's contributions are removed from analysis entirely (useful for a brief, unrelated exchange mid-recording).
To assign roles: review the listed speakers for each document, use the dropdown next to each name, and click Save roles. If speakers are missing or weren't identified correctly, click Re-detect respondents to rerun detection.
Create profiles
A profile is a characteristic you can attach to a speaker or a document, so it's available for later filtering, comparison, and subgroup analysis. Each profile has one of three data types:
| Type | Use for |
|---|---|
| Text | Categories or labels - gender, department, role, source, country |
| Number | Numeric values - age, year, income, score |
| Boolean | Two-state values - yes/no, true/false, present/not present |
Document profile examples: source, document type, year, country, organisation, department, project phase.
Speaker profile examples: age, gender, role, profession, affiliation, stakeholder group, level of experience.
To create a profile: open the Profiles tab, click Add Characteristic, name it, choose its type, and set Applies to - Speaker or Document. Click Save.
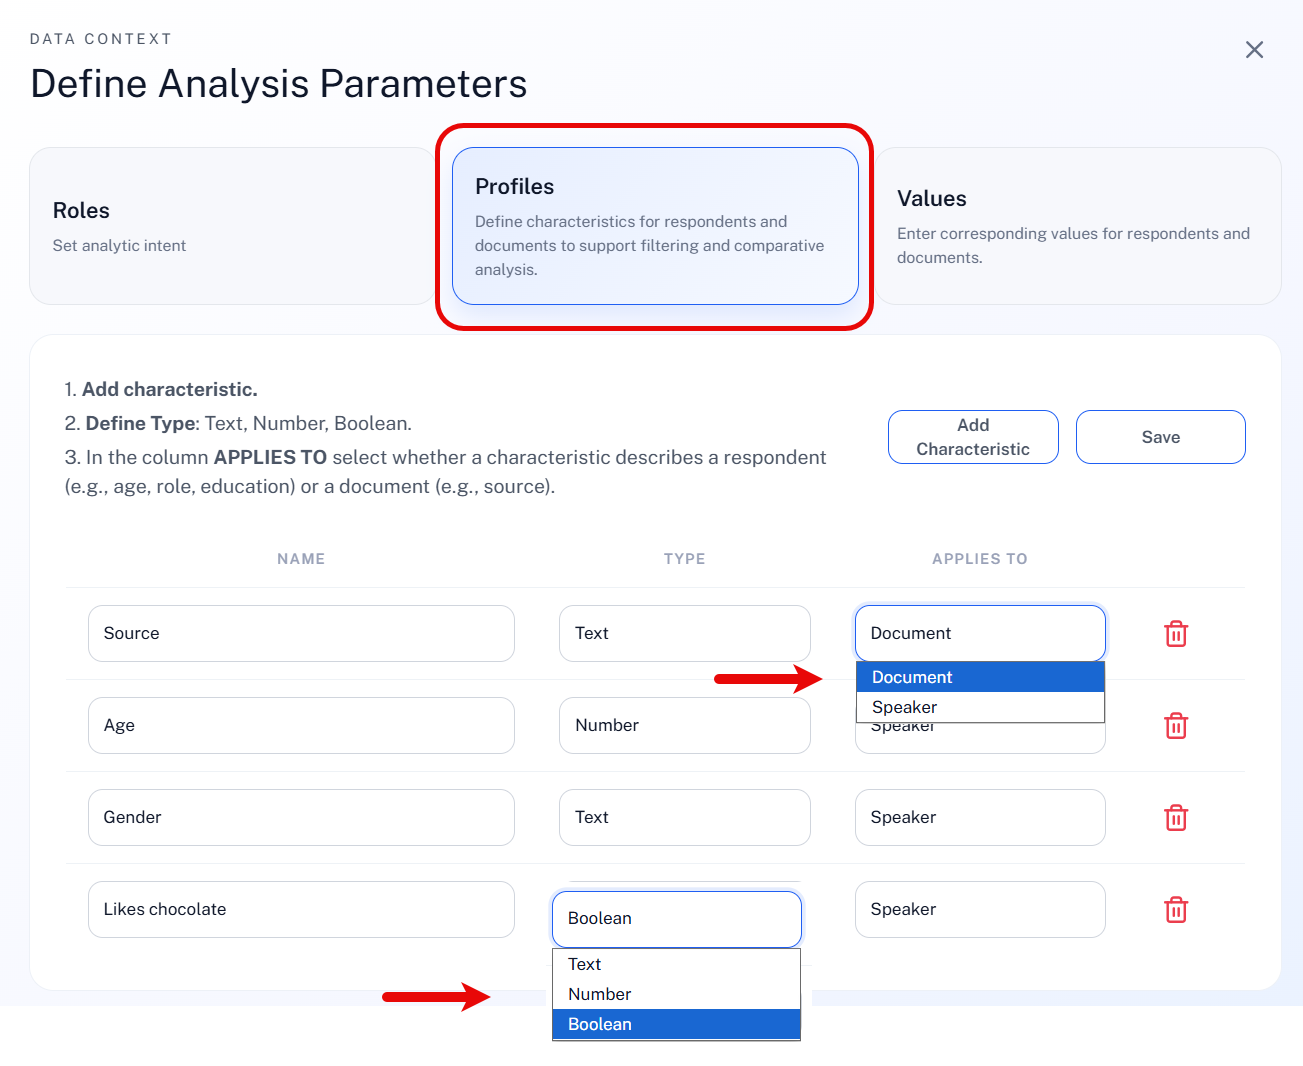
Create only the profiles that are relevant for comparison or filtering later. Too many unnecessary fields make setup more complex without improving the analysis.
Add values
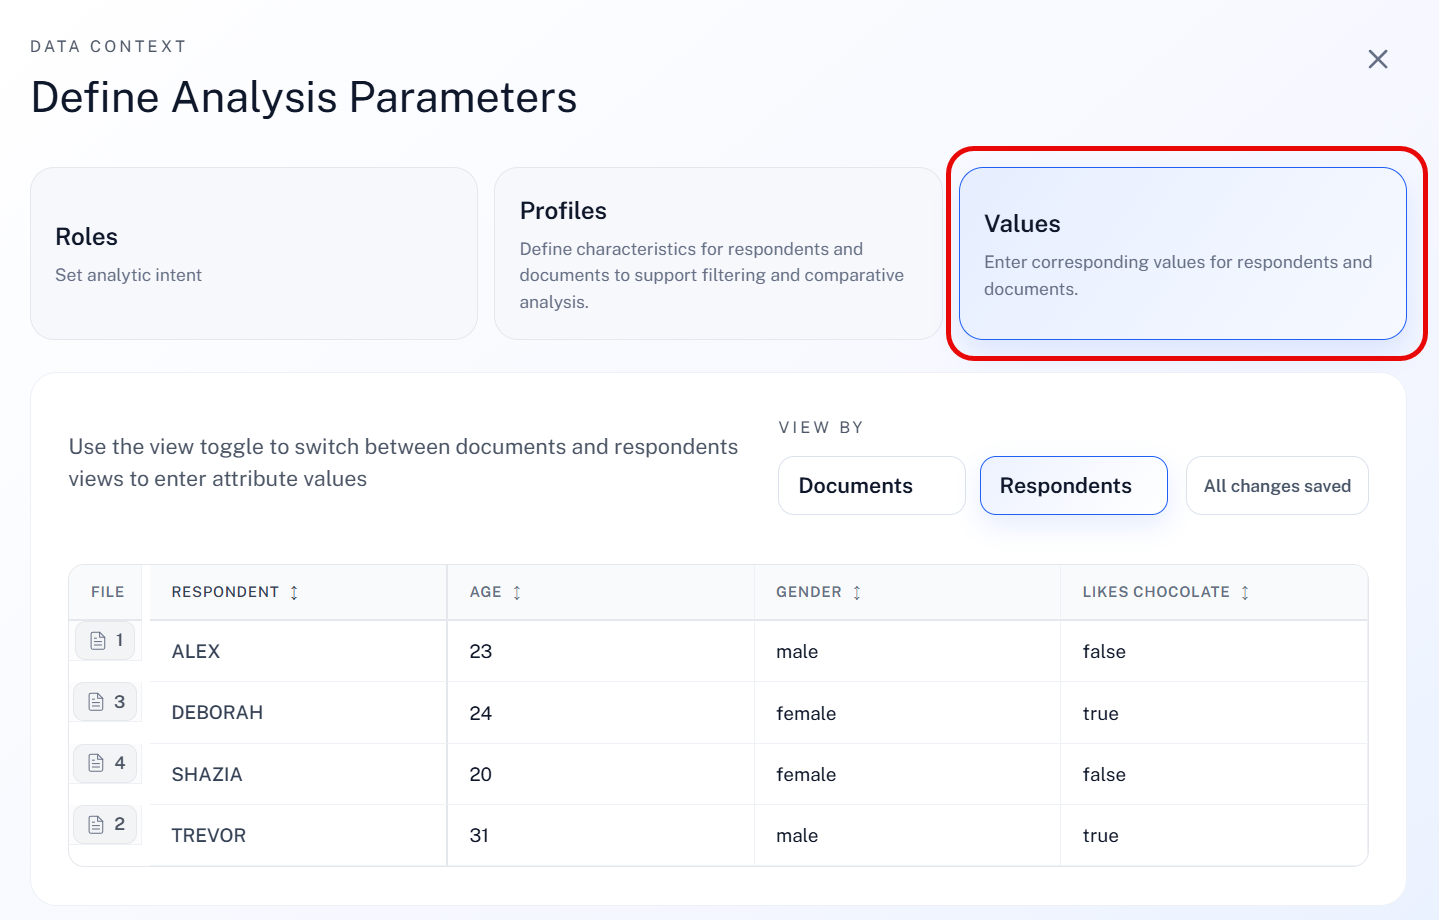
Open the Values tab and switch between Documents and Respondents view, depending on where the profile applies. Locate each document or respondent in the table and enter the relevant values - changes save automatically as you type.
Making use of profiles during analysis
Profile data gives Q important context about your documents and respondents - it's taken into account during analysis even when no filter is set. You can ask directly about differences by gender, role, department, or any other profile characteristic in your data context.
Filters aren't required to analyze group differences; their purpose is to create subsets of the data and reduce the scope of analysis when that's helpful. Working with a focused subset - one respondent group, one department, one document type - often produces more nuanced answers than querying the full dataset at once. See Filters for how to apply them, and Prompting Strategies for guidance on when to query all data versus a subset.
How each analysis mode uses profile data:
- Conversational Analysis - the most flexible: refer to profile data directly in your prompt (for example, "responses from women" or "respondents with a certain rating").
- Sentiment Analysis - subgroup exploration works best in a follow-up chat after the initial run.
- Theme Analysis - respondent filters set in advance are recognized and applied during the analysis.
Next steps
Continue to Filters to learn how to select documents and respondent subsets before running an analysis.