Excel files are well suited to short-to-medium text entries organized row by row: classic open-ended survey responses, but also social media comments, customer reviews, evaluation comments, app or game feedback, and similar text-based responses.
- Formats:
.xlsx(recommended),.csv - Recommended size: up to about 1,000 cases per file. Slightly larger files may work depending on response length and complexity, but very large datasets should be split.
Preparing your spreadsheet
- Remove all header and footer information.
- The file should contain only one sheet.
- Each row should represent one case, response, or unit of analysis.

Column headers can include case IDs, names, variable names, like counts for social media data, open-ended question titles, or review text. QInsights reads these columns automatically and adds them to Data Context, where they can be used for filtering, comparison, and subgroup analysis.
Tip: shorten long open-ended questions used as column headers to save space on screen - for example, use "What qualities, abilities or skills do we need to develop?" instead of the full multi-sentence survey question. You can paste the full-length question into the project description if you want Q to have that context.
Uploading an Excel file
Click Upload New File, select your spreadsheet, and click Proceed. QInsights then asks you to classify each column:
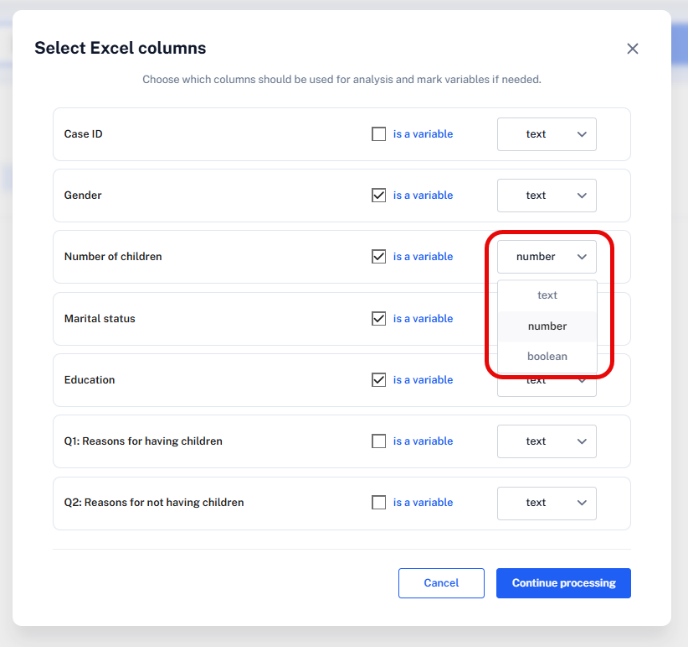
- Is a variable - check this for columns holding background information, identifiers, ratings, or other metadata you'll use for filtering or comparison later (gender, age, education, marital status, number of children, and similar). For each variable, also set its type: Text, Number, or Boolean.
- Leave unchecked for columns containing the actual text responses to analyze (answers to open-ended questions, reviews, comments, feedback).
Click Continue Processing once you've classified every column you need.
Tip: classify case IDs (or other identifiers) as text to be analyzed rather than as a variable - this lets you reference case IDs directly in a chat answer when you ask for quotes.
Reviewing imported data context
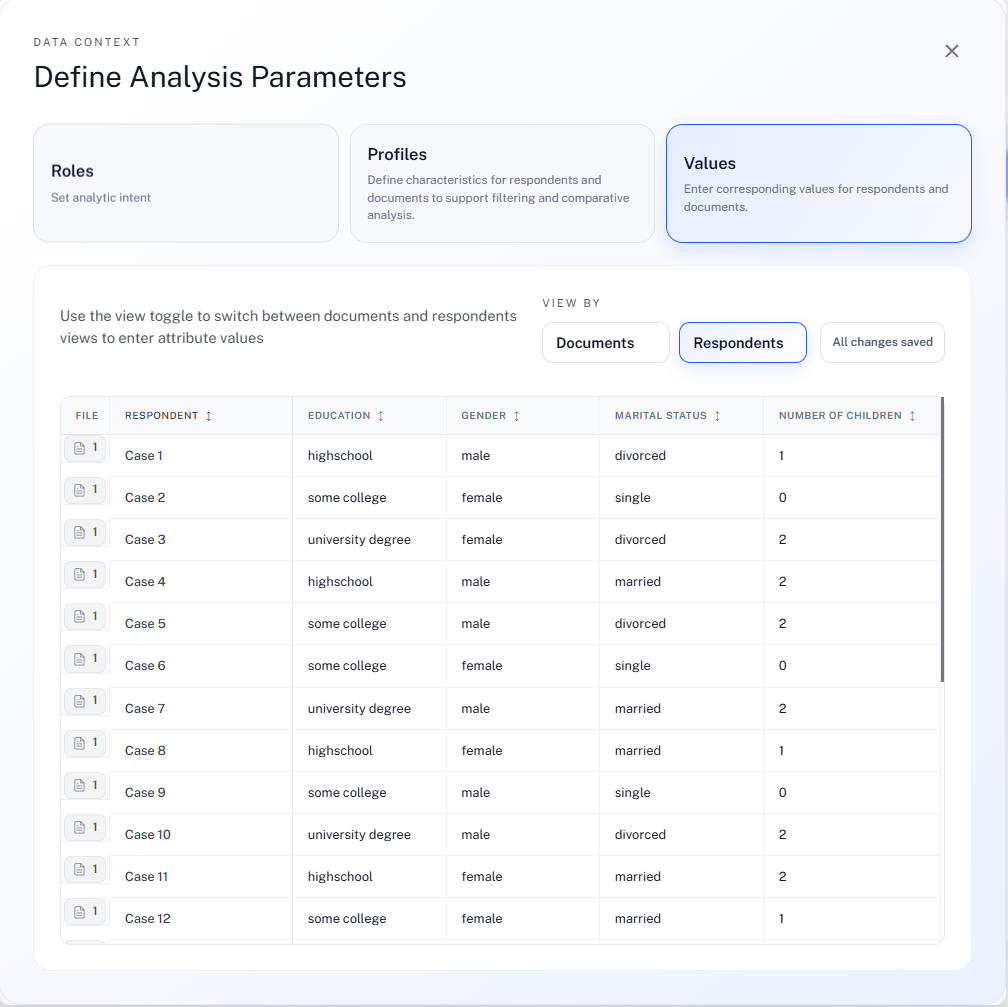
After processing, open Data Context → Values → Respondents to see how spreadsheet variables were imported, one row per case.
Keep survey data in its own project
Excel data is processed differently from Word, PDF, audio, or video files and can't be combined with them in a single analysis. Keeping spreadsheet-based data in a dedicated project also keeps Data Context manageable - a file with many columns can otherwise make it complex quickly.
Selecting columns at analysis time
When you run an analysis, QInsights asks again which columns to include, since it rarely makes sense to analyze every open-ended question together. See Filters for that step, and Sentiment Analysis for spreadsheet-specific analysis guidance.