Grid Analysis is a structured way to organize and compare responses from interviews and focus groups against specific topics or interview-guide questions. Responses are displayed case by case in a clear grid, keeping the respondent perspective visible while still letting you explore the data in more depth. Supports Word and PDF files.
Creating a grid
- Select the documents to include, click Analyse, and choose Grid Analysis.
- Choose an existing grid to continue, or enter a name to start a new one, then click Continue.
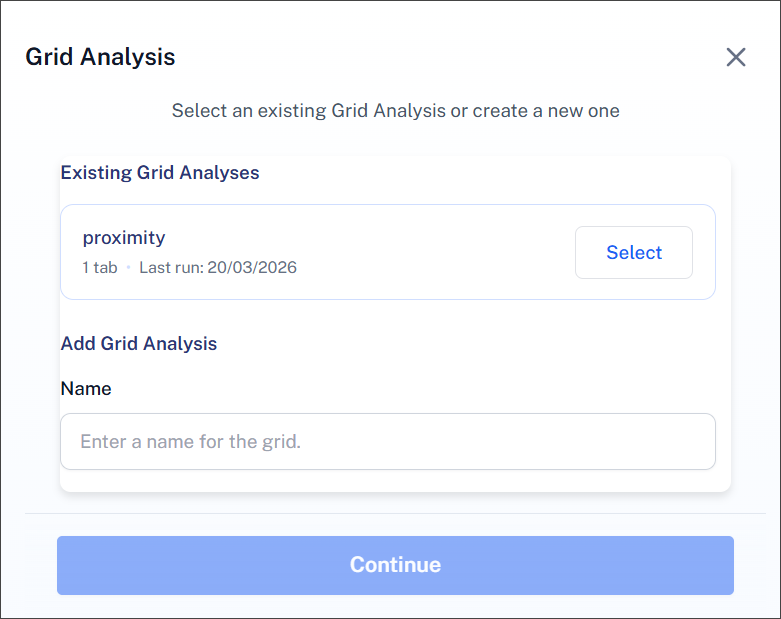
Creating separate grids can help organize larger projects - for example, one grid per research question, per theme or topic area, or per manually selected document set.
Starting an analysis
Enter your first analytic question and click Ask Question.
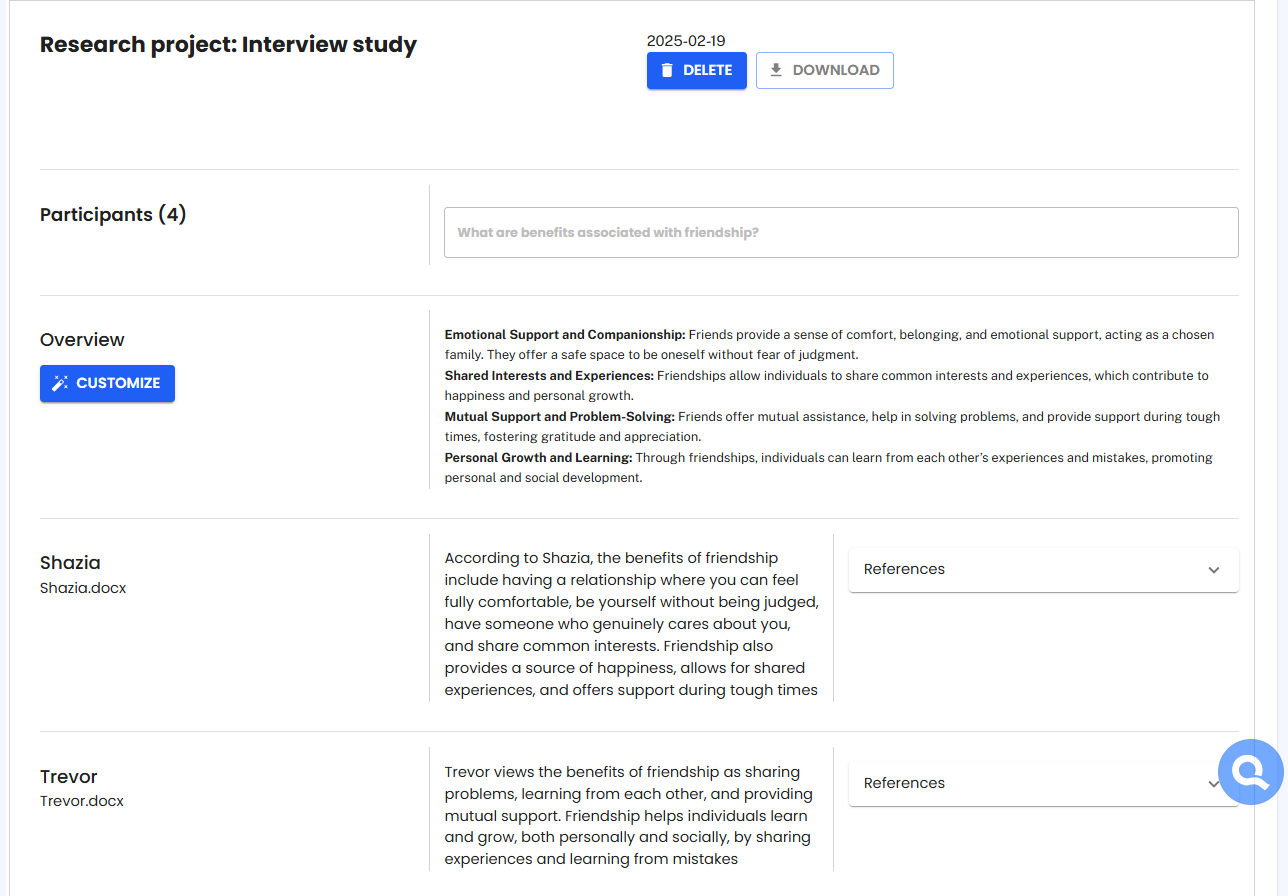
- Overview - a summary across all respondents, shown above the individual rows. Click Customize to change its format (for example, organized by respondent, as continuous text, or as a table) by describing what you want and clicking Modify.
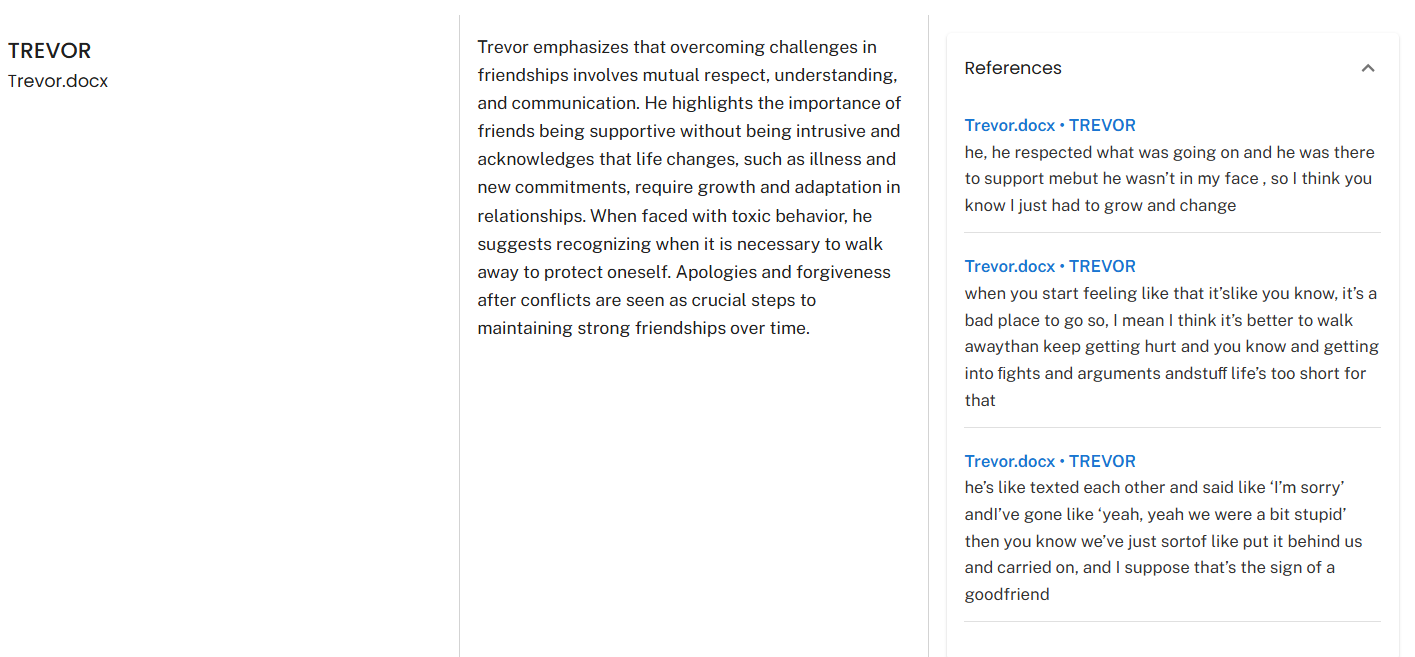
- Per-respondent summary - click References under any respondent's answer to see the original source passages the summary is based on.
Follow-up chat
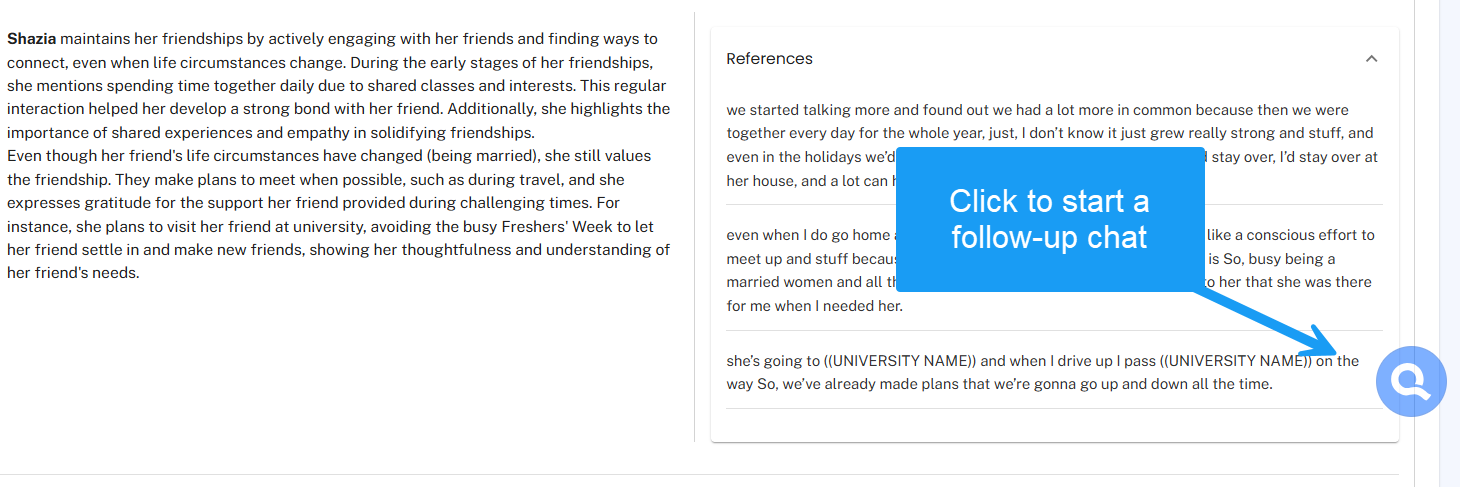
Click the Q icon to open a follow-up chat linked to the grid for more detail or to see references in the fuller context of the documents. Use the arrow icon to expand the chat to full-screen, and again to return to the split view showing both the chat and the grid.
Building a multi-question grid
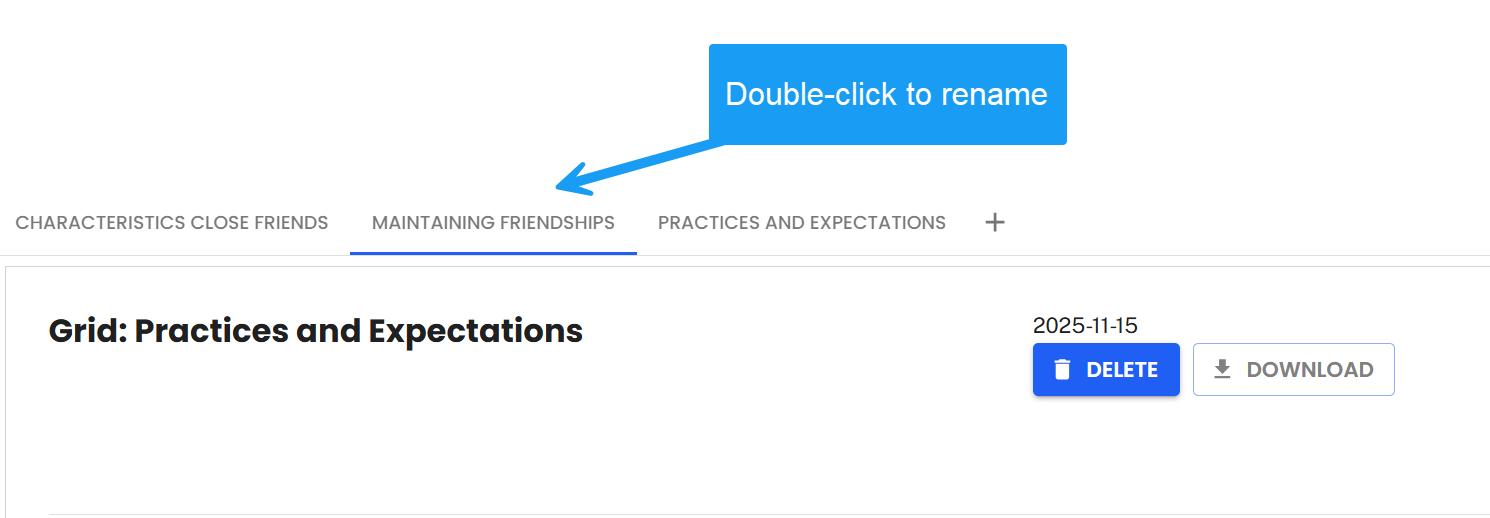
Click the + button to open a new tab and ask another question - each question becomes its own tab, letting you build a multi-question grid over time. Double-click a tab to rename it so it reflects its topic or purpose.
Exporting
Click Download and choose:
- Word Document (.docx) - for reading, editing, or reporting
- Excel Spreadsheet (.xlsx) - with color-coded formatting; choose Current Tab Only or Full Session (every tab exported to its own worksheet)
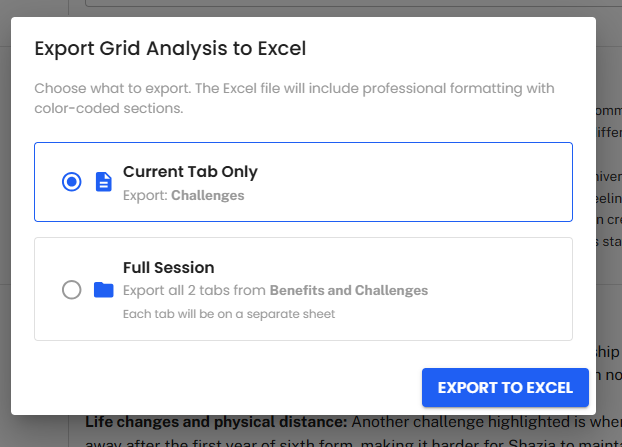
Clear, informative tab names make an exported Full Session file much easier to navigate.
Best practices
Start with descriptive questions, not interpretive ones - for example, "What types of attitudes toward topic X are expressed by each respondent?" or "What did respondents say about [specific topic]?" Your interview guide questions are a good starting point for populating a grid. Once you have a descriptive overview, add follow-up questions to explore similarities, differences, or nuances.
Avoid relational or comparative questions in the grid itself - for example, "What are the relationships between participant attitudes and their stated values?" Answers to those can't be attributed to a single respondent and are hard to display in grid format. Use Conversational Analysis or a grid follow-up chat for that instead.
When to use Grid Analysis
Grid Analysis is particularly valuable for:
- tracking responses by participant for comparison
- quickly identifying what was said without reading full transcripts
- preparing for deeper, interpretive analysis by organizing data into a digestible format first
For richer interpretation, combine it with follow-up questions or Conversational Analysis.