
QInsights can extract topics from Word, PDF, and Excel files, each serving different purposes:
Word files are typically used for interview or focus group transcripts.
PDF files often contain articles and reports.
Excel files are ideal for analysing open-ended responses from surveys, discussion boards, stakeholder feedback, or social media comments.
A Content Mapping Approach
Topic Analysis provides a high-level overview of your data by identifying key areas within the uploaded documents. Think of it as creating a content map of your data, highlighting areas of interest to guide deeper exploration.
The topics are exploratory and designed to provide pragmatic, actionable starting points. It enables you to interact with your data in a meaningful way while retaining control over the direction and depth of the analysis.
How Topic Analysis Works
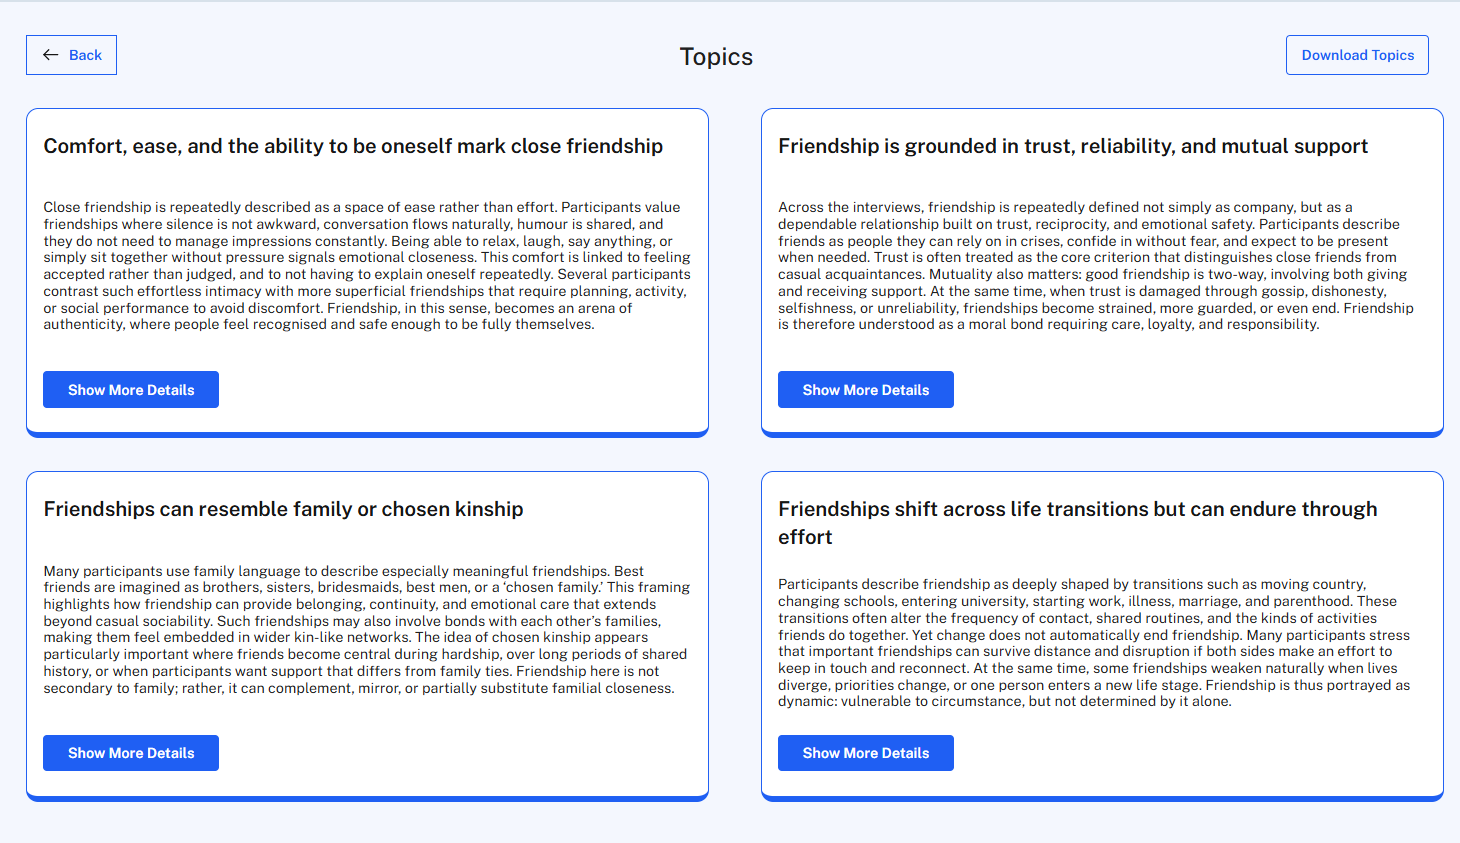
The first step generates between 2 and 10 topics based on patterns and recurring areas of content across the selected documents.
These topics should be understood as initial content-oriented suggestions rather than final analytical themes. They indicate areas that may be relevant for further investigation, but they are not intended to provide a finished interpretation of the data.
Depending on the dataset, topics may be relatively broad, may overlap, or may point to different aspects of the same issue. They are therefore best used as starting points for deciding what to examine more closely in subsequent analysis.
The researcher determines which topics are analytically relevant, which require further differentiation, and which may not be useful for the research question. For each identified topic, QInsights provides a short description that summarizes the topic, offering you an immediate understanding of its relevance.
Inspecting References
- Click Show more Details to see how prevalent a topic is and how many quotes from your data support it. The supporting quotes can then be viewed in the original source documents.
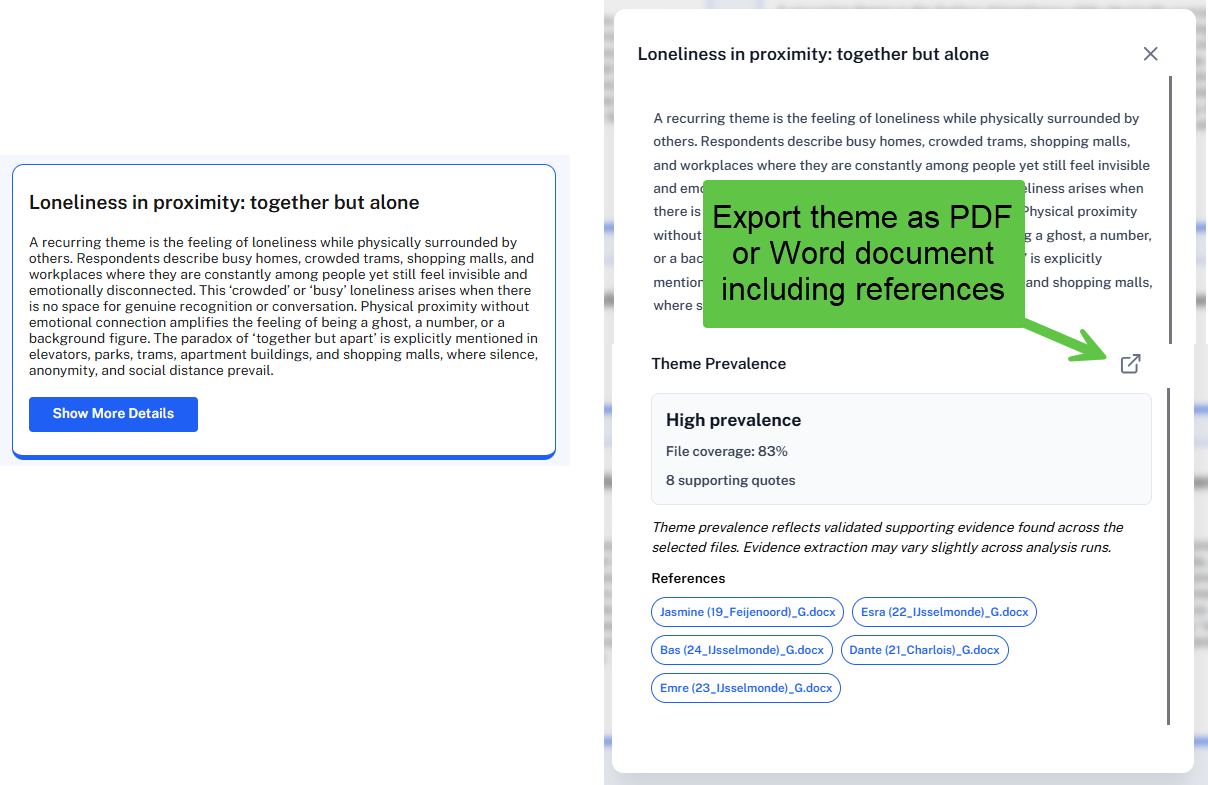
- Click any document name listed under references.
This opens the document preview showing the data segments that contribute to the topic. These segments are highlighted in yellow.
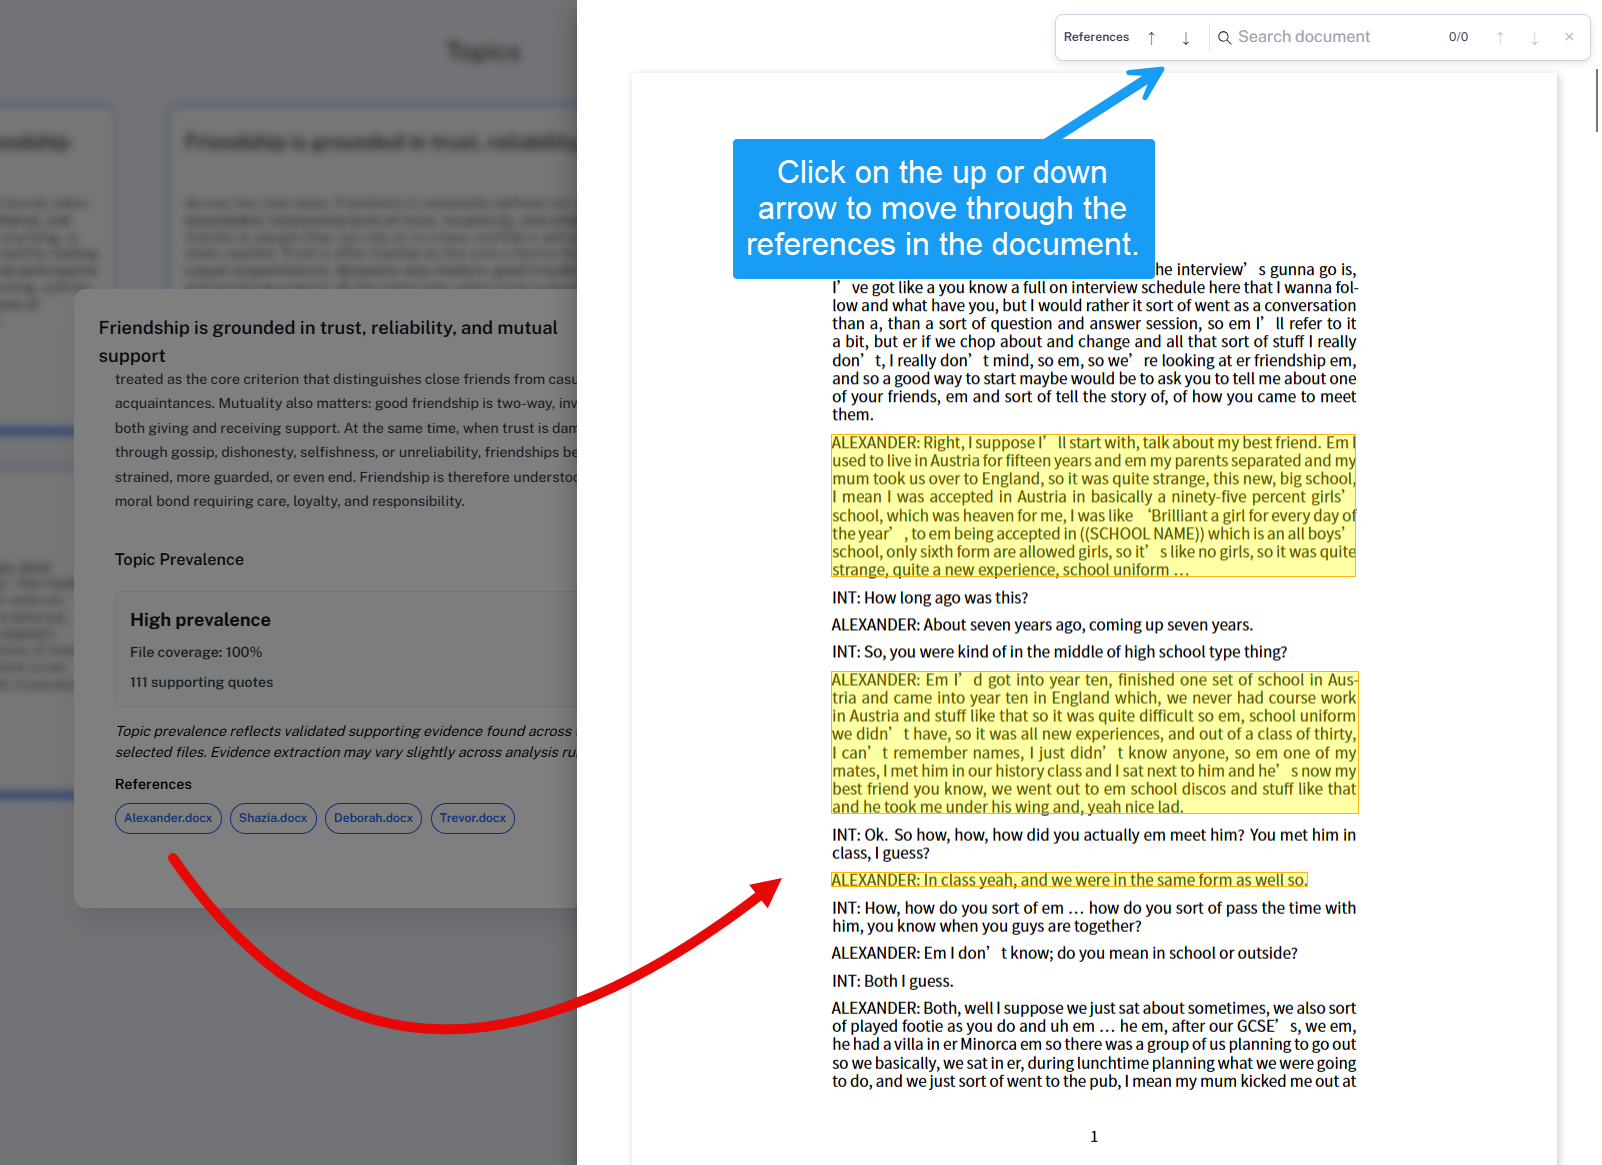
- Click the Up and Down arrows to move between highlighted reference passages.
For each reference, the complete paragraph containing the relevant passage is highlighted. This provides enough surrounding context to assess how the reference relates to the generated answer.
The highlighted paragraph should not be interpreted as a coded segment or as indicating that every sentence contributed equally. It points you to the relevant location so you can review the evidence in context and validate the analysis against the original data.
You can also use Search document to find any word or phrase, including material not captured by the references.
References and Output for Excel Files
Inspecting references for Excel files works differently.
- Click Show More Details when analysing an Excel file to export all data segments that belong to a specific topic.
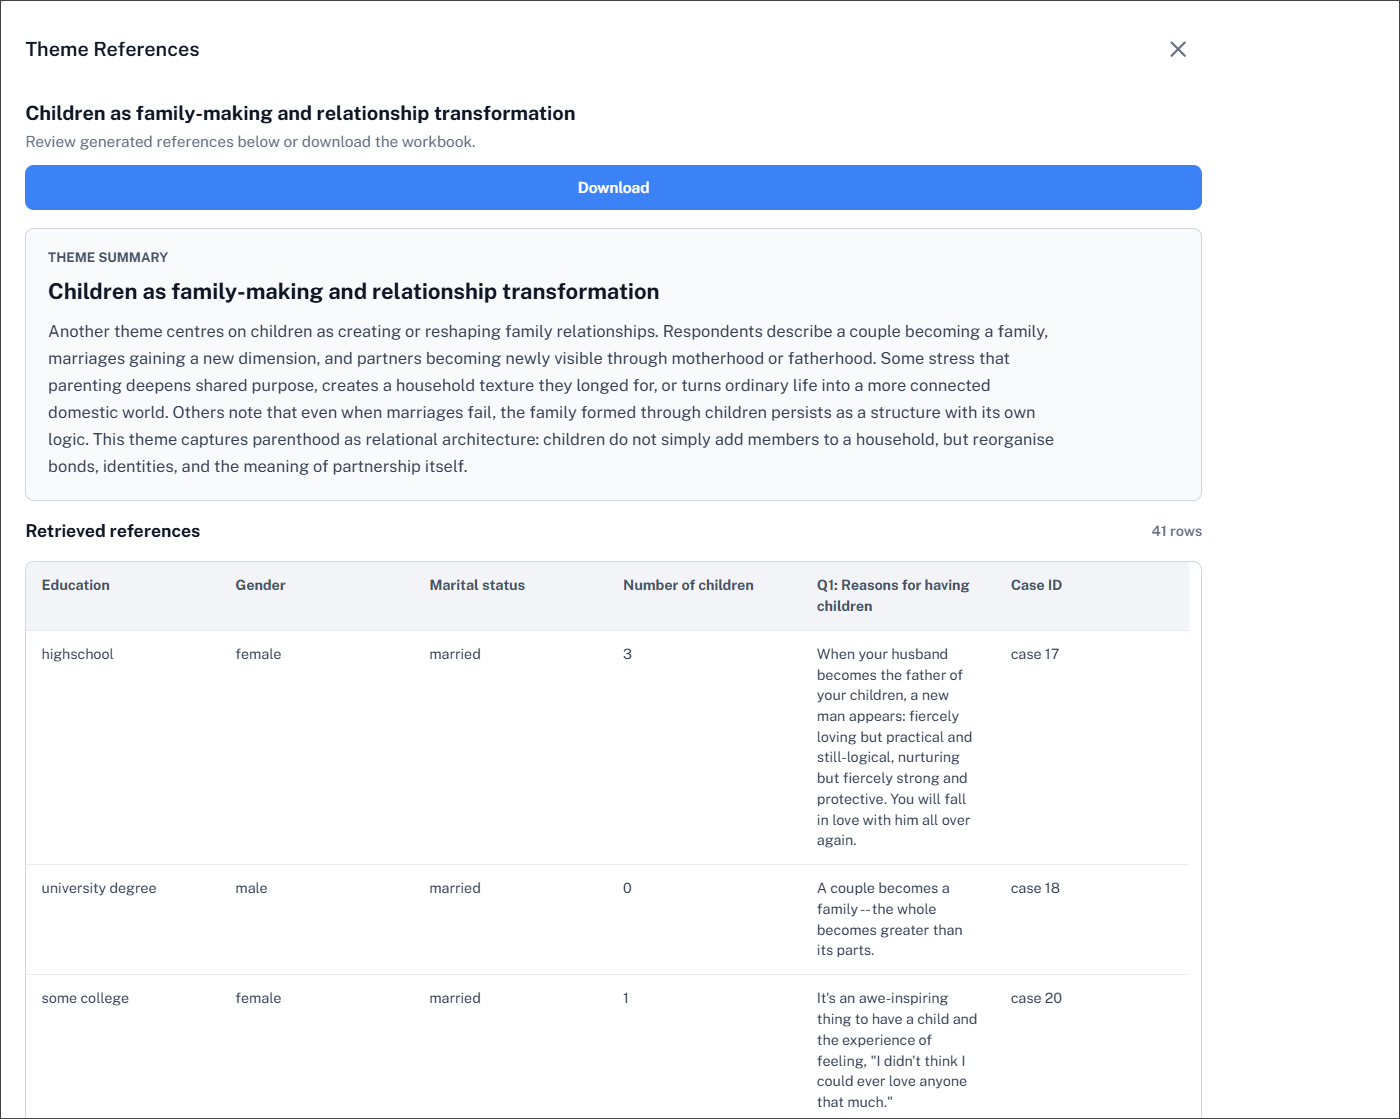
- Click Get References. QInsights generates an Excel file containing all references for a topic.
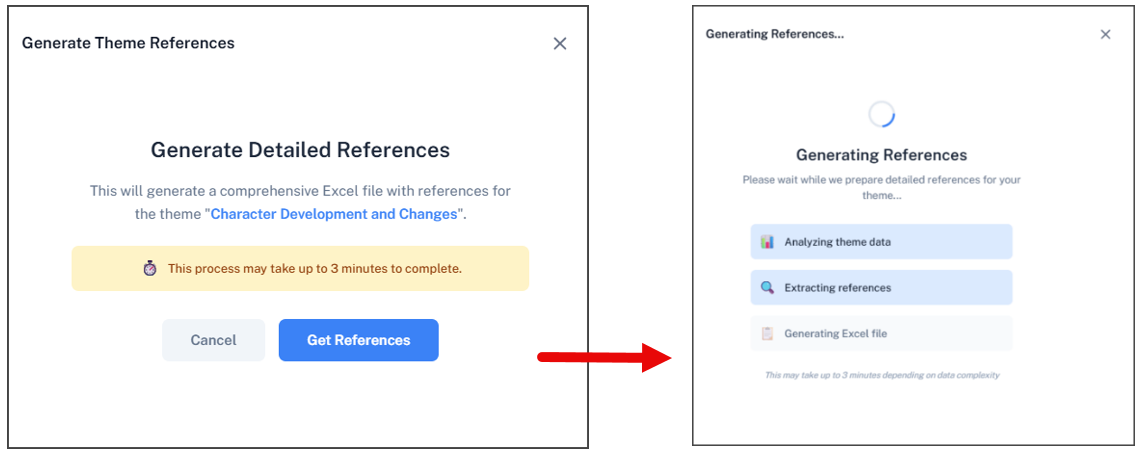
Before exporting the results, you can inspect them. All variables included in your Excel file are also shown.
To download the references for all topics:
- Click Download all references at the top right of the screen.

Export all Topics with References (Word/PDF)
When analysing Word or PDF documents, you can export all topics with references in either Word or PDF format.
The first part displays an overview of your topics, including how prevalent each is.
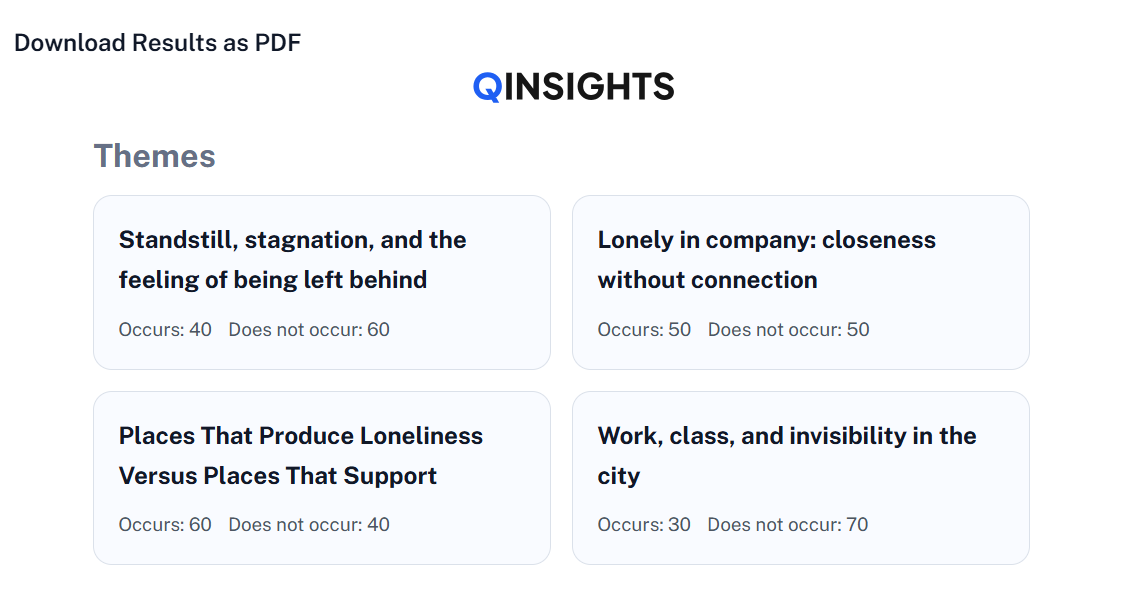
The second part provides each topic description and references for each document, including page numbers.

Interactive Exploration: Follow-up Chats
Once the topics are identified, you can ask follow-up questions to explore the data further and refine your understanding. Thus, the topics identified by QInsights are not an endpoint but a starting point for analysis. They serve as a guide to help you:
- Identify potential topics of interest to explore further.
- Prioritize areas for deeper investigation based on the prevalence of a topic.
- Save time by quickly highlighting what your data is "about" before diving into more detailed analysis.
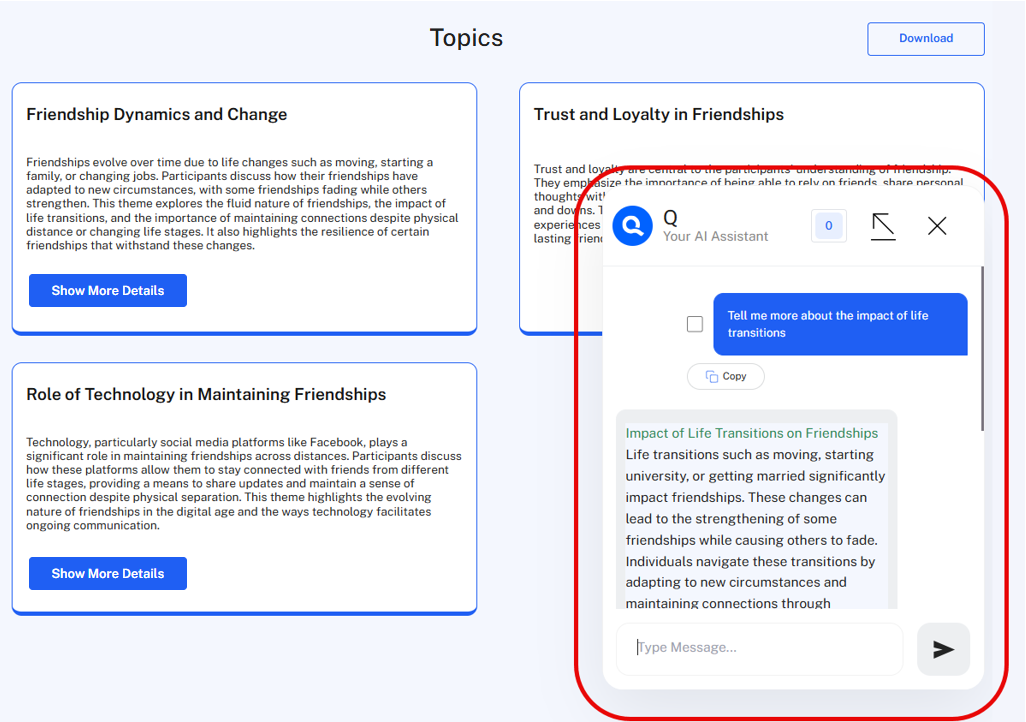
- To start a Follow-up chat, click on the blue icon for Q, your AI-assistant at the bottom left of your screen:

Follow-up conversations will be linked to the corresponding topic analysis in the analysis archive.
Changing the Chat Display
 Click the arrow icon to open the chat in full-screen view. Click it again to return to the split view and display both the chat and the topic analysis.
The Value of Topic Analysis
The value of Topic Analysis extends beyond simple identification and exploration. With the insights gained from the initial topics, you can make informed decisions on how to allocate your research efforts effectively. This could mean choosing to delve deeper into highly prevalent topics or exploring fewer common topics that could uncover unique insights.
Ultimately, Topic Analysis in QInsights is not just about understanding what your data contains; it's about strategically using that knowledge to drive your research forward. Whether you're conducting academic research, market analysis, or evaluating user feedback, the topics provide a robust foundation for developing deeper, actionable insights that can influence real-world decisions and strategies.
By mapping out the main topics and their connections, you can develop a comprehensive understanding of your data landscape, which empowers you to navigate through your data with precision and purpose. It equips you with a content map that is both a snapshot of your current data and a compass guiding your future research directions.
With this content mapping approach, QInsights not only simplifies the complex process of data analysis but also amplifies your ability to extract and utilize knowledge, turning unstructured data into a structured opportunity for growth and discovery.