
Conversational Analysis in QInsights is a dynamic, researcher-guided tool designed for deep data exploration. It accommodates structured methods like inductive and deductive analysis but also serves as an accessible entry point for beginners. If you're unsure where to start, the QInsights AI assistant can help by suggesting preliminary questions to probe your data, making it easier to dive into analysis without needing extensive background knowledge in specific research methodologies.
How Conversational Analysis Works
Step 1: Choose Your Starting Point
- Novice: Start by asking the QInsights AI Assistant: "I am new to qualitative analysis can you suggest some initial questions to explore my data?" This method is perfect for easing into qualitative research and effectively engaging with your data without prior experience.
- Inductive Approach: Dive into your data and let the emerging patterns guide your analysis.
- Deductive Approach: Use established theories or hypotheses as a framework to examine and interpret your data.
Step 2: Engage in Dialogue with Q, your AI-assistant
- Ask specific, focused questions based on your objectives or areas of interest.
Q will search within and retrieve your data to provide nuanced responses, offering insights or summarizing relevant portions of the dataset – depending on how you ask your question (see Analysis Guidance).
- To validate the AI answer, click on a document name below the response:
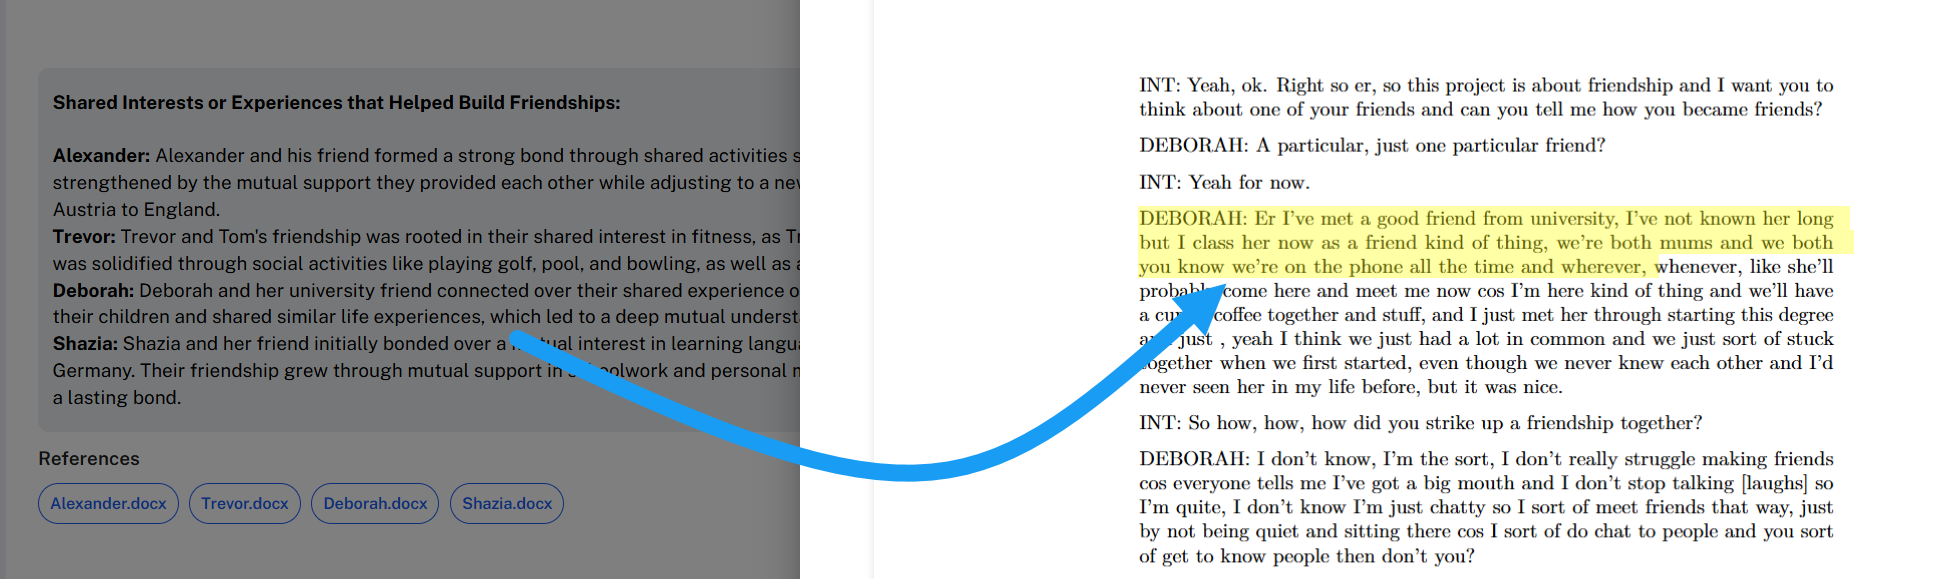
As already explained under Topic Analysis, the highlights show the parts of the transcript that were most relevant to the answer. They are not like “coded segments” and should not be treated as such. Sometimes you will see only half a sentence or a small fragment highlighted. Think of the highlights as pointers to the right region of the document, not as precise markings. Their purpose is to help you validate the AI’s answer against your data.
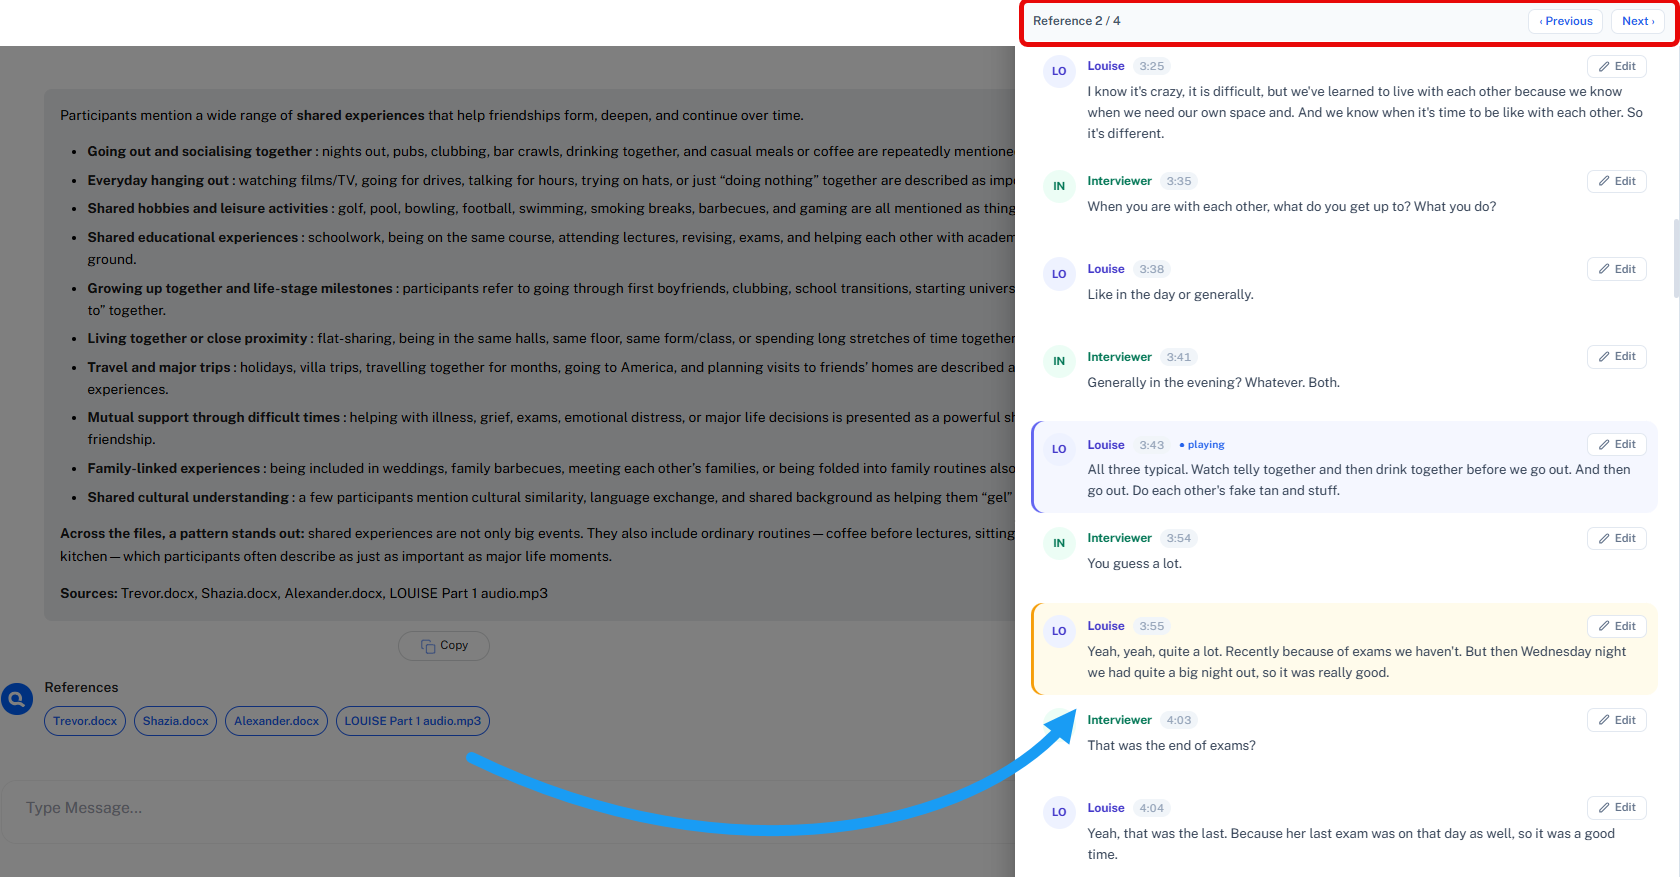
Below you see an example for an audio reference. As with text, you can click on the Previous and Next button to jump through the references.
Step 3: Iterate and Refine
- Build on Q’s responses by asking follow-up questions to clarify or deepen your understanding (see the section Follow-Up Questions for examples).
- Uncover patterns, relationships, or exceptions by steering the conversation in the direction most relevant to your analysis.
Talk To Your Data (Literary)
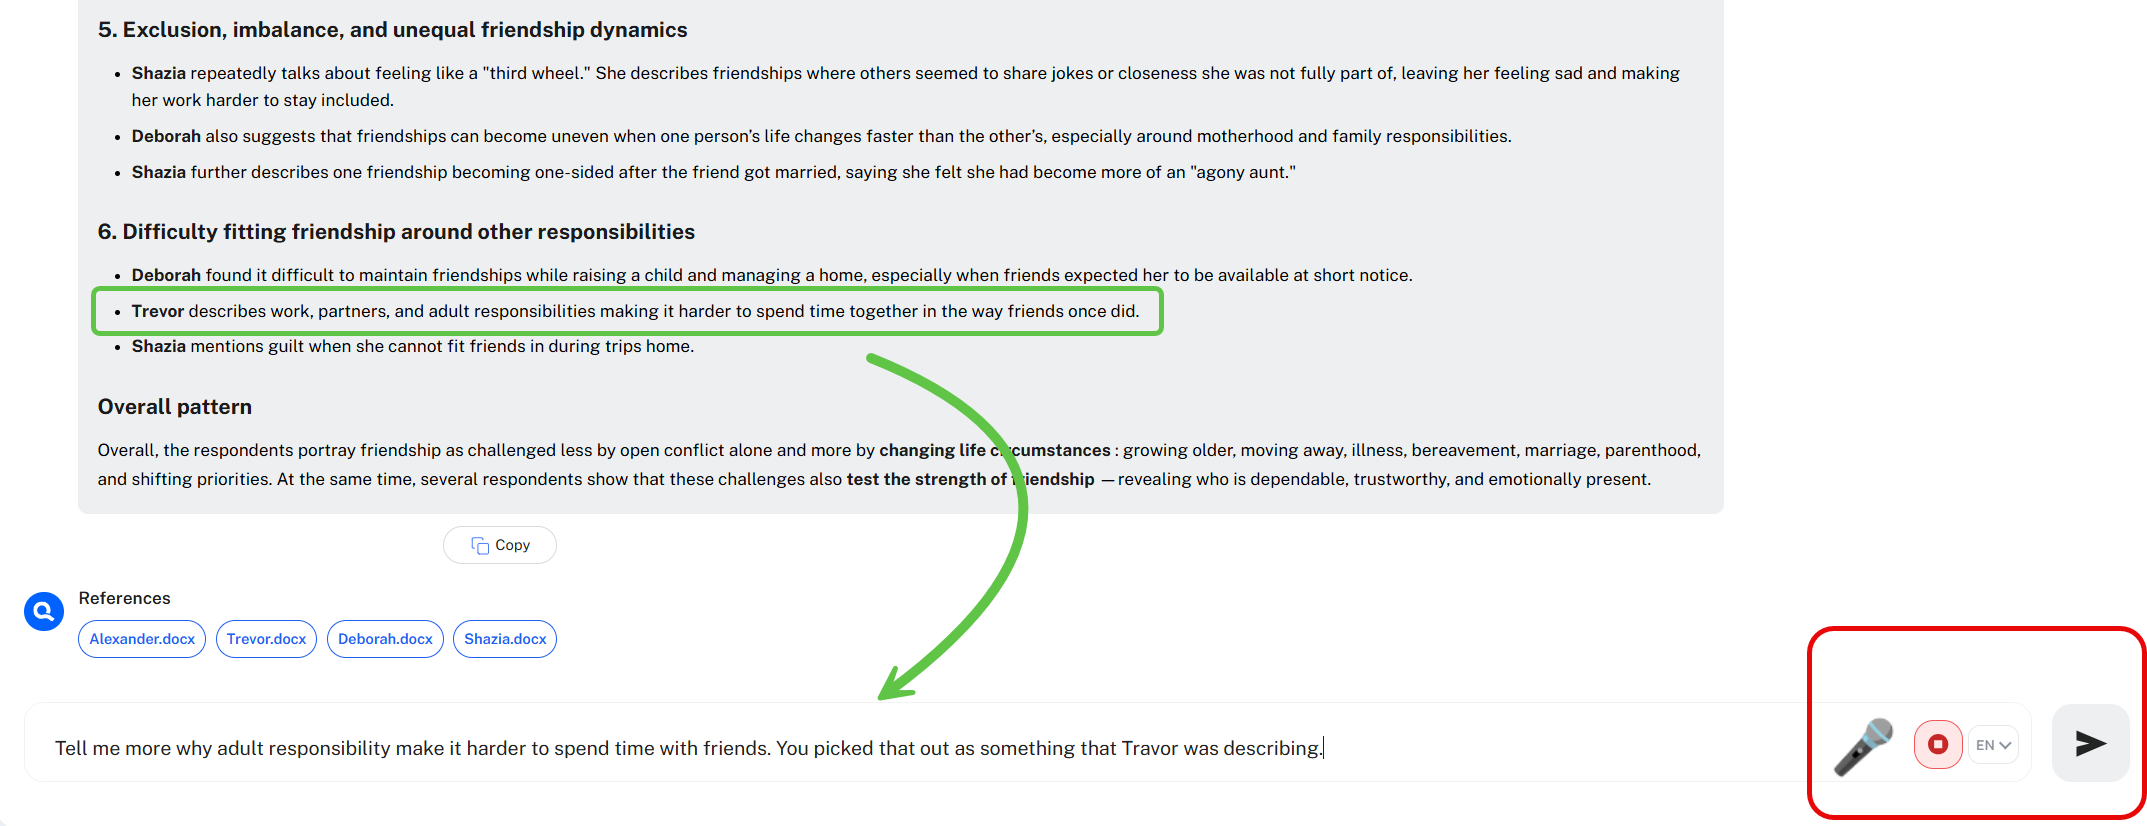
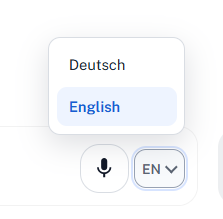
You can now speak your instructions for Q rather than typing it. This currently works for English and German and only in Chrome. We will extend this functionality over time.
To give you an example: Here is a chat answer. I was interested in one particular aspect and asked Q about it:
To start talking:
- Select the language and then click on the microphone button.
- Confirm in your browser that you give QInsights permission to use your computer microphone.
- When you are done taking, click on the arrow to run your query as usual.
Creating Visualizations in Chat
You can create a visualization directly from a Conversational Analysis chat. Describe the type of visualization you want and the content it should represent. The visualization is generated from the current analysis and appears directly in the chat.
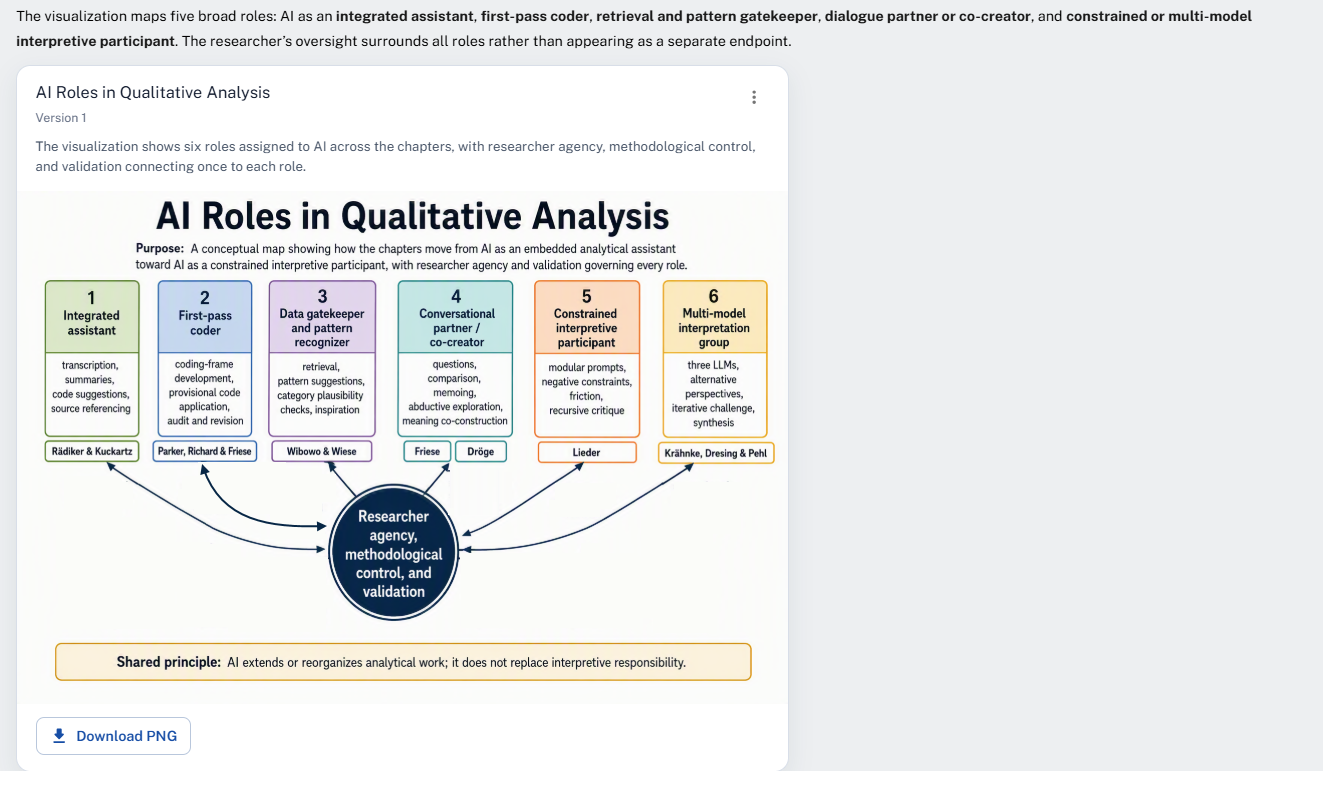
Once a visualization has been created, use the three-dot menu to access additional options:
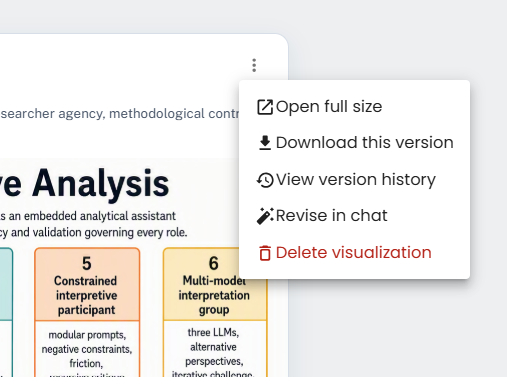
- Open full size – view the visualization in a larger window.
- Download this version – download the current visualization as an image.
- View version history – review and download earlier versions of the visualization.
- Revise in chat – provide instructions for modifying the visualization.
- Delete visualization – remove the visualization from the chat.
Revising a Visualization
When you select Revise in chat, a revision panel opens on the right side of the screen. Enter your requested changes in the chat input field.
As the same chat is also used for questions about your data, it can be helpful to make explicit that your instruction refers to the visualization, for example:
Revise the visualization: keep the current structure but remove the repetitive text below the boxes.
Each revision creates a new version. Previous versions remain available under View version history and can be downloaded separately.
Visualizations in the Archive
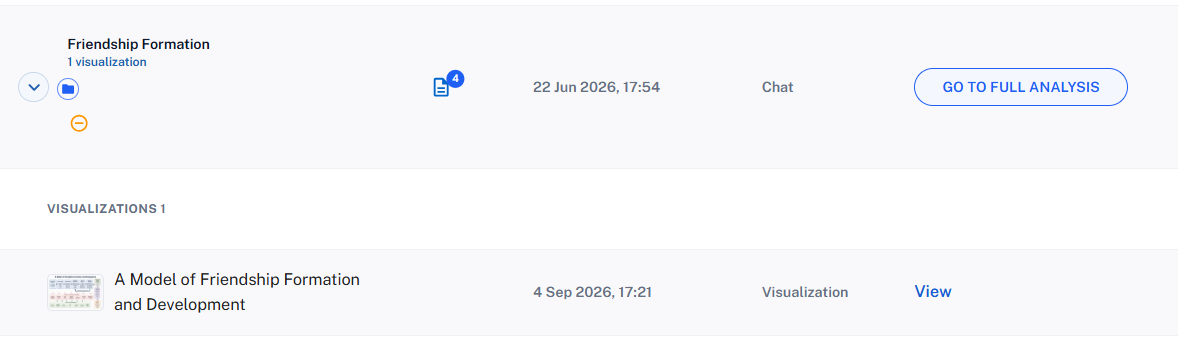
Like follow-up chats, visualizations are also listed together with the chat in which they have been generated. They can also be downloaded from the archive.
Chat Action Bar
The action bar at the top of the chat provides controls for managing the current analysis and its results.

Active Filters: Shows how many filters are currently applied. A value of 0 means that no filters are being used.
Select All: If you want to download the chat, you can either selects all questions and answers in the current chat. You can also select individual items using the checkboxes beside them.
Download: Downloads the selected chat content. This button becomes active after one or more items have been selected.
Clear chat: Removes all questions and answers from the current chat so that you can start a new conversation with the selected documents. Save or download any content you want to retain before clearing the chat.
Save: Saves the current chat to the Analysis Archive. Use the arrow beside the button to open the Save as option, which allows you to save the chat under a new name. Before you close a chat, you always will be asked to save it, so you do not lose an analysis when you close without saving. In case your browser crashes while you are in the middle of the chat, we auto save the chat for you. If you return to the chat after logging in again, you will find the content preserved.
Support: Opens the support options if you need help while working in the chat.
X Close: Closes the chat and returns you to the previous project view.
Below the action bar, the document labels show which files are currently included in the analysis. When many files are selected, the remaining number is displayed in a combined label such as +5 Files.