
Grid Analysis in QInsights is a structured way to organize and explore responses from interviews and focus groups. This feature is useful when you want to examine specific topics in a way that is closely aligned with your research questions or interview guide. By displaying responses in a clear grid format, it provides an accessible overview while still allowing you to explore the data in more depth.
Grid Analysis can be used with Word and PDF files.
How Grid Analysis Works
- Ask a Question
Begin by entering a specific question. You can also include keywords if you want to direct the AI assistant toward particular terms, phrases, or aspects of the data. QInsights then locates and summarizes the relevant responses for each respondent. - Explore Summaries and References
For each respondent, QInsights provides a summary of the answer to your question. You can also open the reference field to see the original source passages on which the summary is based. - Ask Follow-Up Questions
You can refine the analysis by asking follow-up questions within the grid. This is useful when you want to explore one aspect in more detail or clarify a pattern you have noticed. In the archive, the follow-up conversation remains linked to the corresponding Grid Analysis. - Build Your Grid Step by Step
Responses are displayed in a grid format, with one row per respondent and one column per question. Each new question creates a separate tab, allowing you to build the grid gradually. Tabs can be renamed to keep the grid organized and aligned with your analytic focus.
Creating a Grid Analysis
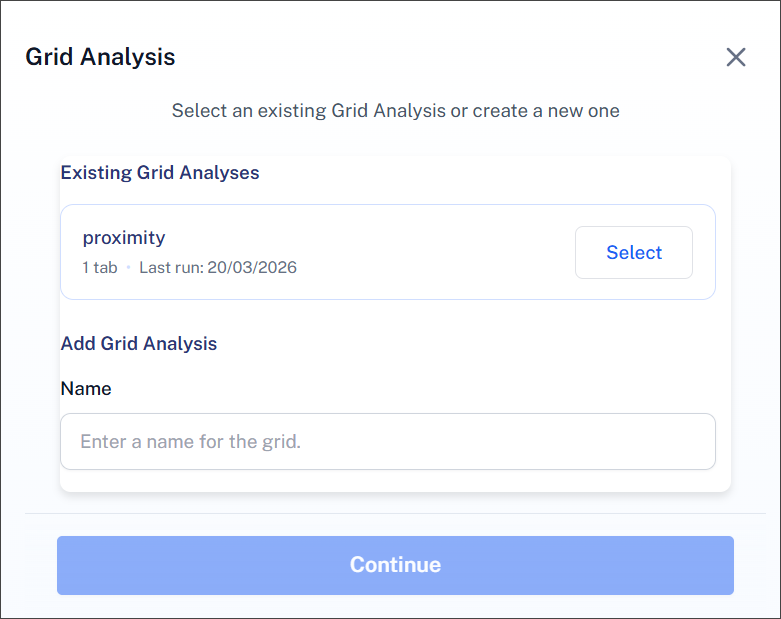
When you start a Grid Analysis, QInsights asks you whether you want to continue an existing grid or create a new one.
To start a Grid Analysis
- Select the documents you want to include in the analysis.
- Click Analyse and choose Grid Analysis.
- In the dialog window, decide whether you want to:
- select an existing Grid Analysis and continue working in it, or
- create a new Grid Analysis by entering a new name.
- Click Continue.
Creating a New Grid or Continue Working on an Existing One
When you use Grid Analysis for the first time in a project, there will be no existing grid to select. In that case, enter a name for the new grid and continue. If one or more grids already exist, you can either continue working in one of them or create a separate new grid.
Creating different grids can be useful when you want to organise your work by analytic focus. For example, you might create:
- one grid for each research question
- separate grids for different topic areas
- separate grids for different manually selected document sets
This makes it easier to keep larger analyses organised and prevents unrelated questions from being mixed together in one grid.
Starting Analysis
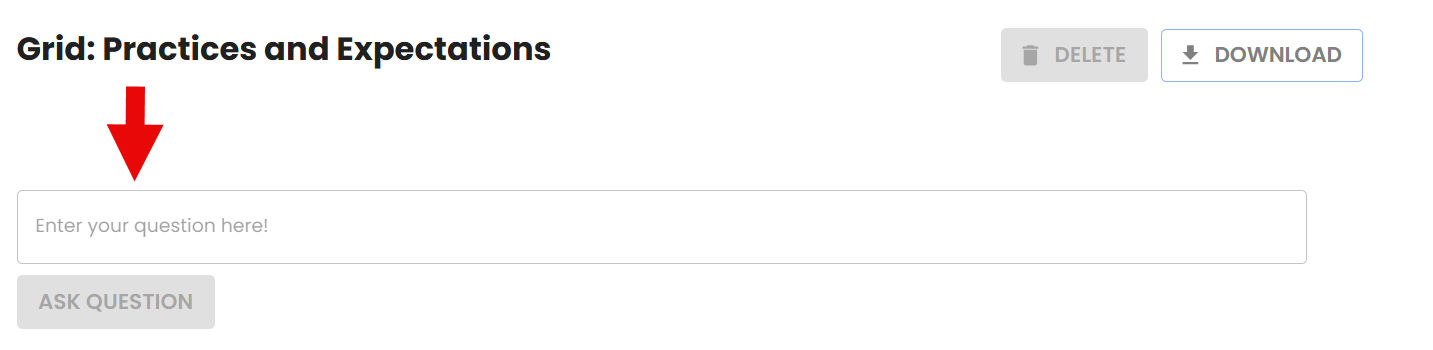
- Enter your first analytic question.
- Click on Ask Question.
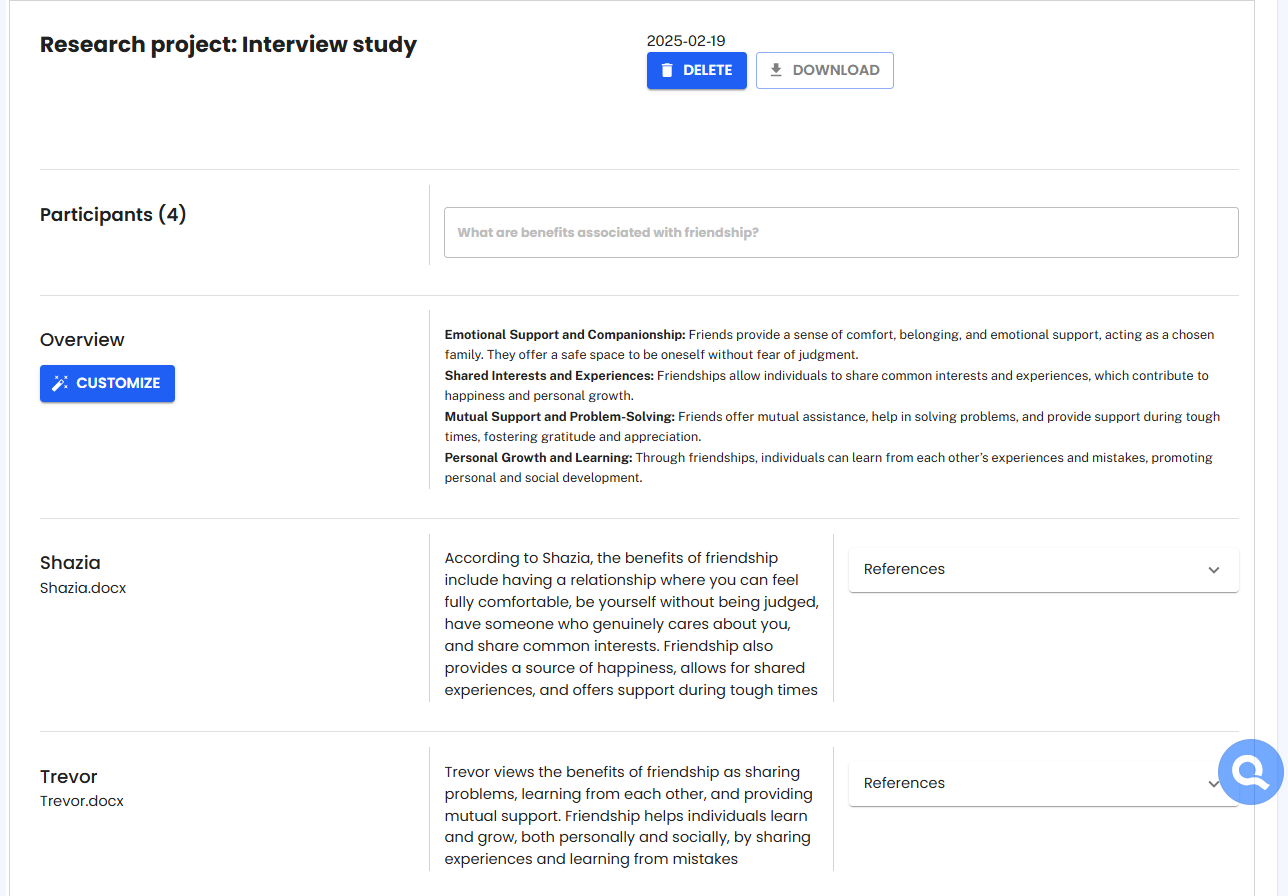
This is a possible result of a Grid Analysis:
Overview
Above the individual respondent answers, QInsights provides an Overview that summarises the responses across all respondents.
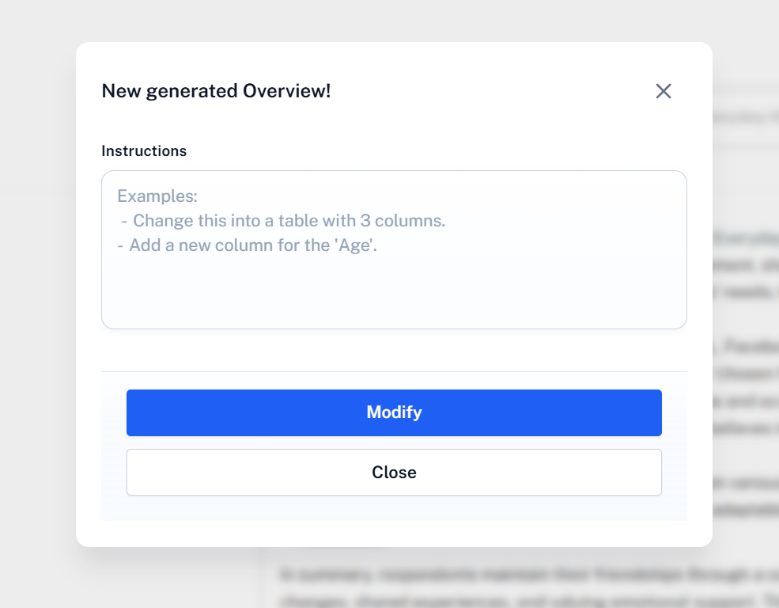
If you want the overview in a different format or more / less detail, click Customize and enter instructions for how the output should be presented. For example, you can ask for a summary organised by respondent, a descriptive summary in continuous text, or a table.
- Click on Customize and a window opens where you can add your instructions.
- Provide instructions in what way Q, your AI assistant should regenerate the summary and click on Modify.
Summary answer for each respondent
For each individual respondent, QInsights provides a summary answer.
- Click References to display the original text segments from the source file used to generate the summary.
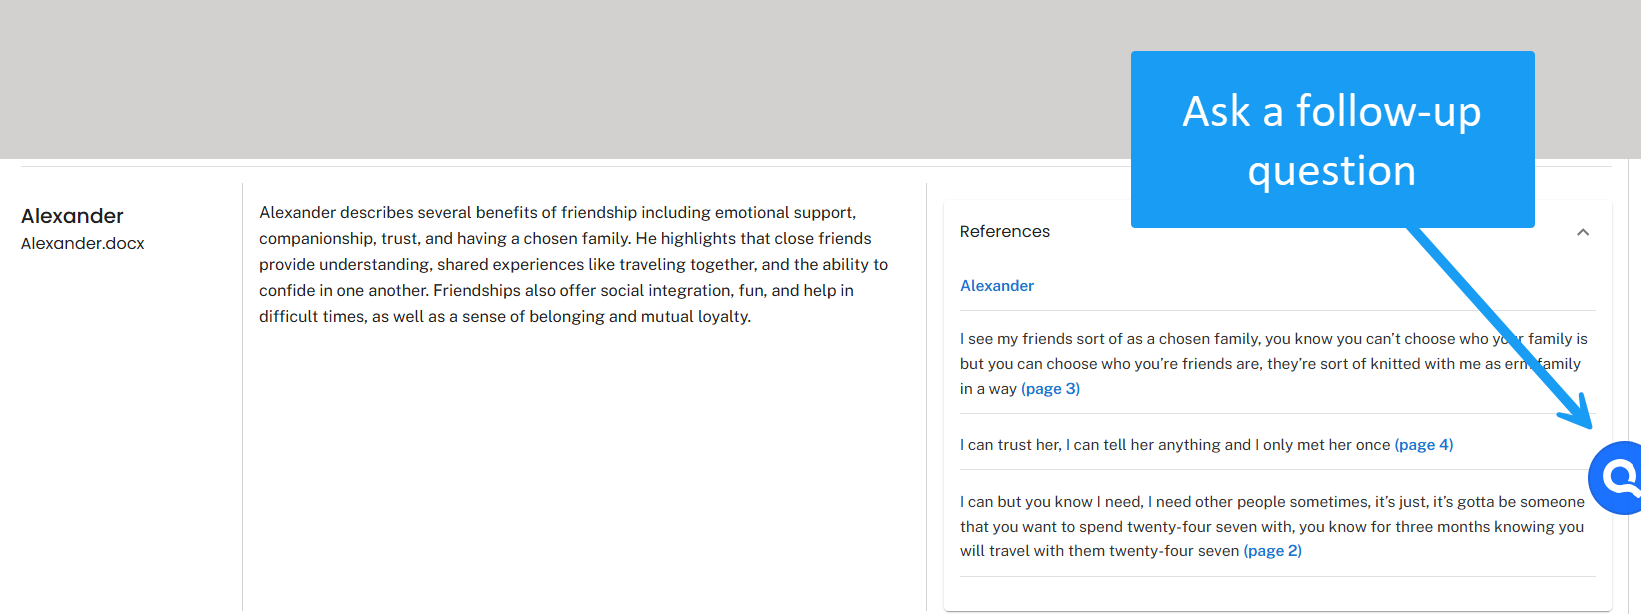
Follow-up Chat
If you want more detail and to see references in context, start a follow-up chat by clicking the blue button with the Q at the bottom right of the screen.
Adjusting the chat view
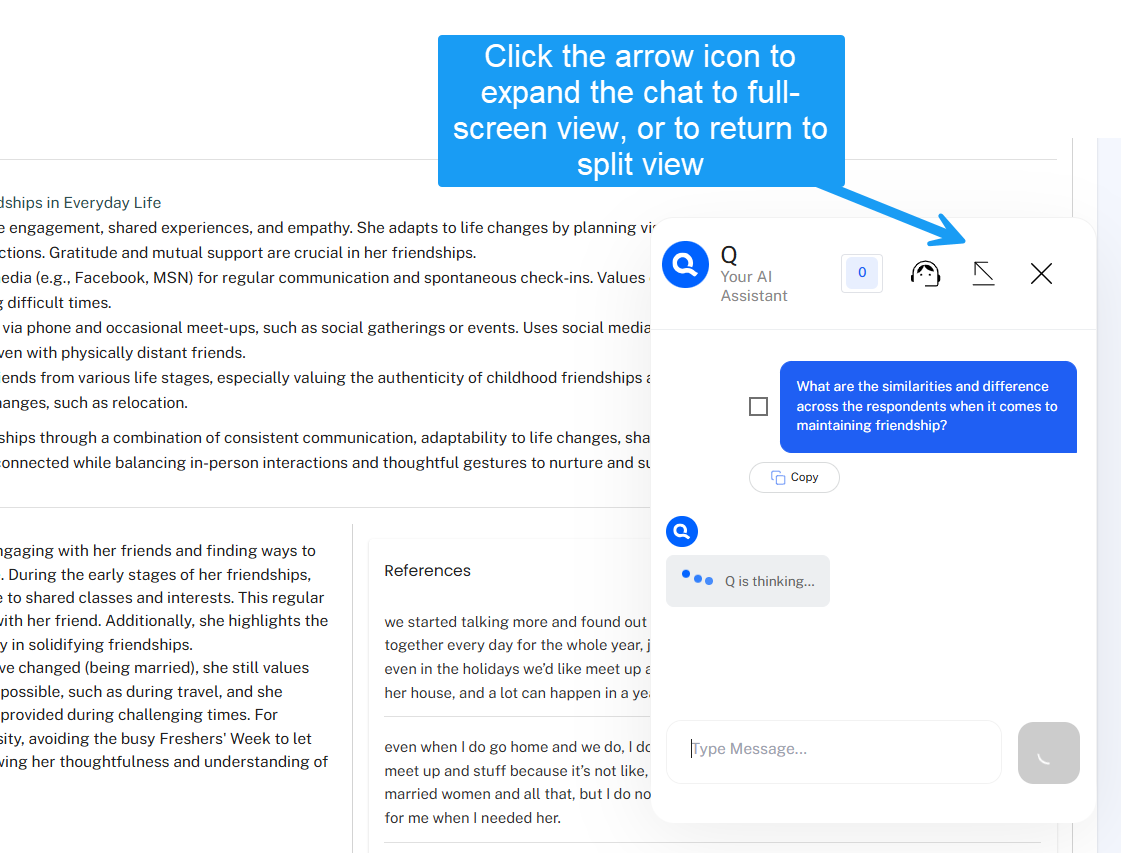
When working with a follow-up chat in Grid Analysis, you can switch between two display modes.
Click the arrow icon to expand the chat to full-screen view. This is useful when you want more space for reading or writing in the chat.
Click the icon again to return to the split view, where both the chat and the grid remain visible on the screen at the same time.
Building a Grid Analysis
- To build the grid step by step, click the plus button; a new tab opens.
- Enter a new question.
Exporting a Grid Analysis
You can export a Grid Analysis in either Word or Excel format.
- To export the grid, click Download in the Grid Analysis view. QInsights then opens a dialog where you can choose your preferred export format.
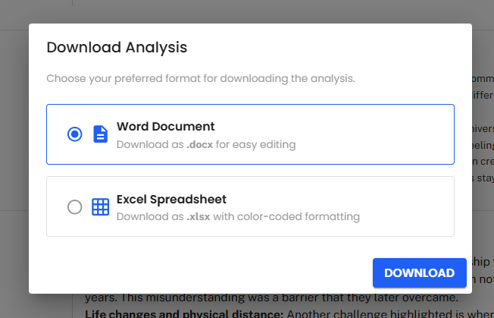
Word Document (.docx)
Choose this option if you want to export the analysis as a Word file for reading, editing, or further reporting.
Excel Spreadsheet (.xlsx)
Choose this option if you want to export the grid in spreadsheet format. The Excel export includes colour-coded formatting to help distinguish the different sections.
If you choose Excel, a second dialog appears with two export options:
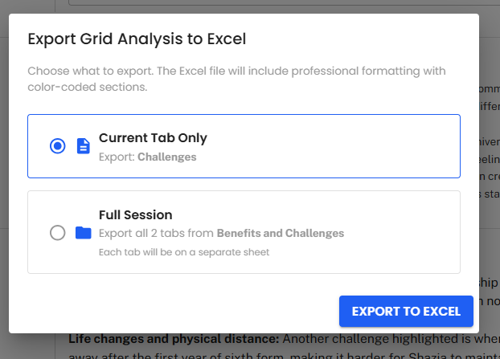
Current Tab Only
Exports only the tab that is currently open.
Full Session
Exports all tabs from the Grid Analysis. Each tab is placed on a separate sheet within the Excel file.
Best Practices for Grid Analysis
Start with Descriptive Questions: Grid Analysis is best suited for content-oriented questions rather than interpretive ones. Examples include:
- What types of attitudes toward topic X are expressed by each respondent?
- What did respondents say about [specific topic]?
These types of questions help you gather an overview of the data before moving to more complex interpretations. A great starting point is to use your interview guide questions to populate the grid.
Once the grid provides a descriptive overview, you can add follow-up questions to explore similarities, differences, or nuances among responses.
Avoid asking relational or comparative questions: Questions like "What are the relationships between participant attitudes and their stated values?" or "What are the differences in respondents' attitudes toward X?" are better suited for Conversational Analysis or follow-up exploration. Answers to those questions cannot be attributed to just one respondent and thus are difficult to display in the grid format.
When to Use Grid Analysis?
Grid Analysis offers a clear and structured way to get an overview of participant responses to key topics. It is particularly valuable for:
- Tracking responses by participant for comparison and analysis.
- Quickly identifying the content of responses without needing to read through entire transcripts.
- Preparing for deeper, interpretive analyses by organizing data in an easily digestible format.
This tool is a starting point to build an understanding and lay the groundwork for richer exploration. For more interpretive insights, combine Grid Analysis with follow- up questions, or Conversational Analysis, to maximize the value of your qualitative data