
Novice Researcher
If you're new to qualitative analysis, you can ask Q, your AI assistant, to guide you. Start by asking something like:
"I am new to qualitative analysis. Can you suggest some initial questions to help me explore my data?"
If you didn’t add your research questions to the project summary during setup, you can include them directly in your prompt to get tailored suggestions that align with your study's goals.
Depending on the amount of data you have, you may want to start with a meaningful subset of your data (4 – 6 interviews) as suggested below for an inductive approach. When you ask a question across a large dataset, such as 30 interviews, the AI is likely to generate an answer that is broad or generalized. This is explained in more detail here.
As you engage with your AI assistant, you’ll probably start to develop a feel for how to ask questions that yield meaningful insights. Over time, you may find yourself becoming more confident and intuitive in framing your own queries, empowering you to explore your data in ways you hadn’t considered before.
Recommendation: As a novice researcher, we recommend using Guided Analysis.
Inductive Approach: From the Descriptive to the Conceptual
When starting inductively, the researcher begins with specific questions aimed at understanding what has been said in the data. This approach is rooted in the data itself, gradually moving from descriptions to identifying more abstract concepts and relationships.
Recommended Steps
- Start Small: Select a subset of your data to begin. This allows you to focus and learn what each respondent (let’s say you selected five) has said about your topic of interest.
- Ask Descriptive Questions: Begin with questions like, "What benefits and challenges have been mentioned?" or "What types of childhood experiences have been described?"
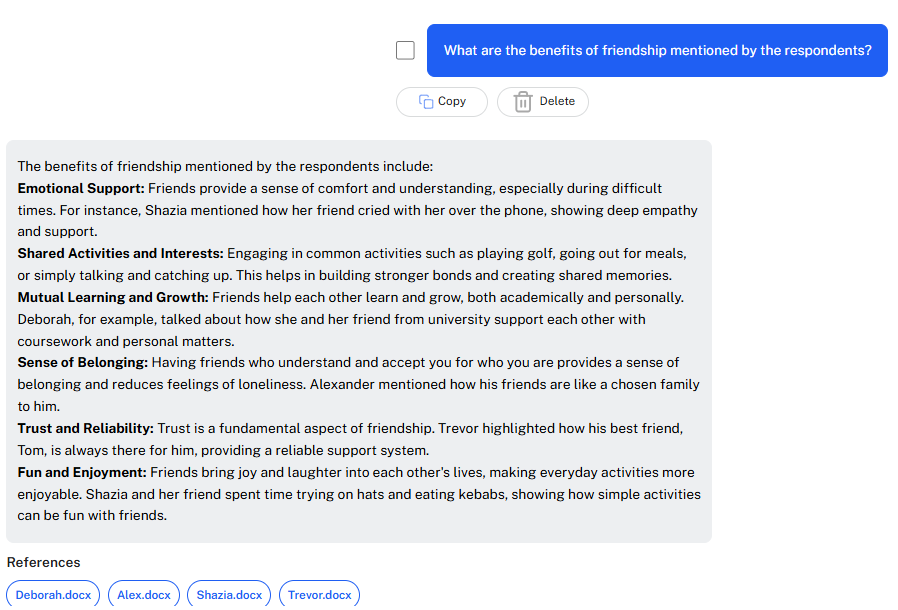
As the question indicates, it's not necessary to specify "as mentioned by the respondents" when using Q, QInsights' AI-assistant. When you ask questions about your research material, QInsights retrieves relevant passages from the selected data and uses them as the basis for its response. References allow you to inspect the supporting material and assess whether the response is adequately grounded in the data. As with any AI-assisted analysis, responses should be critically evaluated rather than assumed to be accurate. If your query is unrelated to your dataset, Q may rely on general knowledge from its underlying language model. For more details on asking questions that is not about your data, see below.
- Identify Similarities and Differences: Compare responses across participants to uncover patterns, trends, and variations. You can also make use of the variables entered during project setup (e.g., gender, age, educational level) to compare and contrast respondent groups. See below for a prompt on how to generate Comparison Tables.
For Word or PDF files, activate these variables under filter settings, allowing your AI-assistant to differentiate respondents based on selected criteria like gender or educational level. Ask questions like, “Are there gender differences regarding the benefits mentioned?” For Excel files, input variables directly in your prompt without needing activation in the settings.
- Group and Label: Use the AI assistant to group similar responses and provide higher-order labels to describe them. For instance:
- A list of benefits might be grouped into "Professional Development" or "Emotional Well-Being."
- Childhood experiences could be classified as "Positive Reinforcements" or "Adverse Events."
- Relate and Contextualize: Once certain concepts and sub-concepts are identified, explore their relationships. For example:
- How does attitude X influence user behaviour?
- What influence did experience X, Y and Z have on the development of a certain leadership style? The example below shows that such questions can also be asked across different documents.
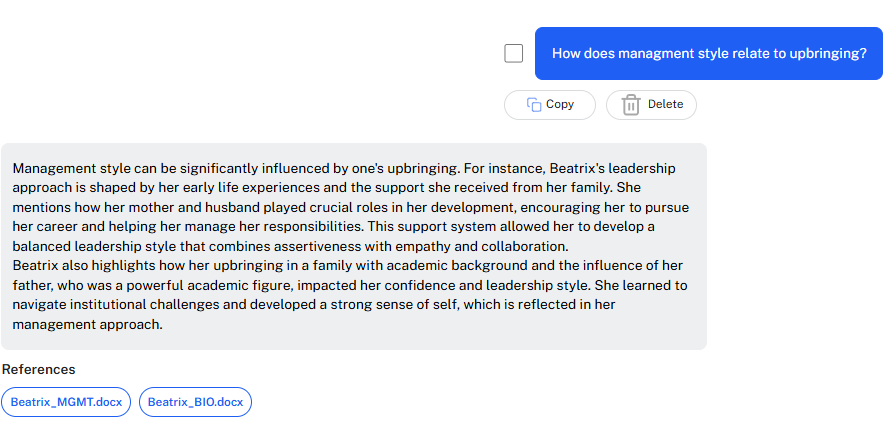
Inductive analysis allows you to discover new patterns, concepts, and relationships through an exploratory process, which can later inform a broader, more structured deductive analysis.
Deductive Approach: From the Conceptual to the Descriptive
When starting deductively, the researcher begins with existing concepts or hypotheses and examines whether and how they appear in the data. This approach moves from abstract ideas to detailed, contextual descriptions.
Recommended Steps:
- Define Starting Concepts or Hypotheses: Begin with a clear framework of what you want to explore. Ask questions and validate:
- Do all respondents mention this specific concept?
- Does a hypothesized relationship between variables (e.g., gender and leadership style) exist in the data?
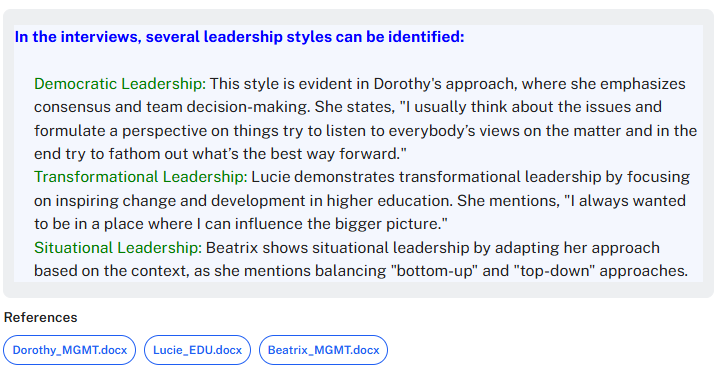
- Here are six leadership styles (define them). Which of them are described / have been mentioned by the respondents?
Example
Below there is a list of 7 different leadership styles. Which of them can you identify in the interviews?
- Autocratic Leadership: A style where the leader makes decisions unilaterally, without much input from team members.
- Democratic Leadership: Involves team members in the decision-making process, promoting collaboration and participation.
- Transformational Leadership: Focuses on inspiring and motivating followers to achieve their full potential and embrace change.
- Transactional Leadership: Based on a system of rewards and punishments, where compliance is expected in exchange for rewards.
- Servant Leadership: Prioritizes the needs of the team and helps members develop and perform as highly as possible.
- Laissez-Faire Leadership: A hands-off approach where leaders provide minimal direction and allow team members to make decisions.
- Situational Leadership: Adapts leadership style based on the maturity and capability of team members and the specific situation.
- Drill Down: Explore specific examples and details to better understand and explain your findings.
- Group-Level Analysis: Use variables entered during project setup (e.g., gender, age, educational level) as filters to investigate patterns. Or asked questions based on information you entered in a header: Is leadership style related to different age groups?
Deductive analysis allows you to test predefined ideas or theories within your data while retaining the flexibility to refine or expand them based on evidence.
Abductive Analysis – Explaining the Unexpected
Abductive analysis is a methodological approach that blends elements of both inductive and deductive reasoning. It focuses on generating the most plausible explanations for observed patterns or phenomena in data. The term originates from the work of Charles Sanders Peirce, who described abduction as a form of logical inference aimed at forming hypotheses to explain surprising or puzzling observations.
Abductive analysis is particularly useful in qualitative research when:
- Unexpected findings arise during the study.
- The researcher aims to bridge empirical data and theoretical insights.
- There is a need for a flexible, iterative approach to understanding complex phenomena.
Abductive analysis starts when you encounter something unexpected, unexplained, or puzzling in the data. You can then think of plausible hypotheses or explanations for shedding light on these anomalies – these then become your theories to be further explored and tested. In the process of abductive reasoning, you oscillate between data and theory, using the data to inspire new ideas and theories to refine your understanding.
How Abductive Analysis Mirrors Detective Work
Abductive reasoning is often compared to the work of a detective because both processes involve piecing together incomplete information to arrive at the most plausible explanation. Here's how they align: Abduction starts with an observation or a surprising fact and seeks the best explanation for it. Example: “Why is this window broken?” → Possible hypothesis: “It was a burglary.”
Unlike deductive reasoning (which guarantees conclusions) or inductive reasoning (which generalizes), abduction selects the likeliest explanation, given the evidence. As new evidence is uncovered, hypotheses are revised or replaced to better fit the facts.
Father Brown, the television series based on G.K. Chesterton's stories, is an excellent example of abductive reasoning in action. Father Brown’s method of solving mysteries beautifully illustrates how this type of reasoning works, as he consistently relies on observation, intuition, and a deep understanding of human nature to form plausible explanations for crimes.
Father Brown starts by noticing details others might overlook. His keen attention to small, seemingly unrelated clues is the foundation of his reasoning: a misplaced object, an unusual tone of voice, or a reaction from a suspect might catch his attention as something worth investigating. He doesn’t jump to conclusions but instead considers various possible explanations for the observed facts. His hypotheses are often guided by his profound understanding of people's motivations, emotions, and moral struggles. For instance, he might hypothesize that a murder wasn’t motivated by greed but by a deeper personal conflict or guilt. By weighing the evidence, Father Brown identifies the most likely explanation. As new evidence comes to light, Father Brown adjusts his hypotheses. He frequently engages the suspects or witnesses in conversation, using their reactions to refine his understanding of the crime.
Father Brown exemplifies abductive reasoning, because he doesn’t focus solely on physical evidence; he considers psychological, emotional, and moral factors to create a complete picture. He remains open to changing his theories as new insights emerge, a key aspect of abductive reasoning. Rather than seeking certainty, he seeks the most plausible explanation for the evidence at hand. His ability to think outside conventional logic mirrors the creative aspect of abduction.
PS: Click on the above link to watch a Father Brown episode on YouTube.
Example of an Abductive Analysis

Imagine you are analyzing interviews about workplace satisfaction, and you find that many employees express satisfaction despite working under highly stressful conditions. This unexpected finding prompts abductive reasoning. You might hypothesize that employees' satisfaction stems from a strong sense of team support or meaningfulness in their work, even under stress. To refine this hypothesis, you revisit the data to look for supporting evidence and consult existing theories about workplace dynamics to shape your understanding further. When using QInsights, you engage in a dialogue with Q to explore ideas, test assumptions, and refine your understanding.
At this stage, it’s the perfect moment to tap into the creative strengths of AI. Use Q to brainstorm a range of possible explanations, even those you may not have considered yourself. The AI can help you explore diverse angles—cultural factors, leadership styles, or even less obvious workplace dynamics—that might explain the surprising satisfaction under stress. By combining its capacity to generate ideas with your critical thinking, you can refine hypotheses and uncover insights that might otherwise remain hidden. This collaborative process highlights how AI can amplify your creativity while keeping you firmly in control of the analysis.
How Abductive Analysis Works in QInsights
You might start looking for unexpected patterns, contradictions, or outliers purposefully; or you stumble across them when exploring your data. In both cases, the findings become the foundation for abductive reasoning. The next steps are:
- Ask Exploratory Questions:
Use Q to probe these observations further. Questions like:
- Why might respondents with similar experiences express contrasting emotions?
- What factors could explain this unexpected behaviour or response?
- Generate Hypotheses
Based on the responses, let Q help you generate plausible explanations for your observations. These hypotheses are grounded in the data but informed by your own expertise and existing theoretical knowledge.
- Iterate and Refine
Abductive Analysis is an iterative process. Move between the data and emerging hypotheses, asking follow-up questions to clarify, refine, or challenge your initial ideas.
- Validate with Data
Test your hypotheses by exploring whether they apply consistently across other subsets of your data or groups of respondents.
In practice, abductive analysis is often used in grounded theory, ethnography, and interpretive research, where the goal is not just to describe but to explain and make sense of social or cultural phenomena. It enables you to move beyond description and into the realm of meaning-making, fostering deep insights and rich theoretical contributions to your research.
Querying All Data vs. Subsets: Striking the right balance in analysis
You can analyse all documents in a project at once, but the size of the selected dataset affects the level of detail in the resulting answer.
When a question is applied across a large dataset, for example 30 interviews, the response will generally provide a broader synthesis across the material. This is useful when you want an overall picture, but it can make differences between cases, less common perspectives, and contradictory evidence harder to see.
Three effects are particularly relevant:
Summarisation
LLM-generated answers condense information. As more material is included, individual observations are increasingly combined into broader patterns and statements.
Dominant patterns become more visible
Recurring ideas across many documents are more likely to shape the overall synthesis. Less frequent perspectives, exceptional cases, or subtle differences may receive less attention.
Case-level detail is reduced
The larger the dataset included in a single query, the harder it becomes to retain the context and specificity of individual respondents or documents within one answer.
For more detailed analysis, it is therefore often useful to work with smaller, analytically meaningful subsets and compare the results across groups. You can then return to the full dataset when you want to examine whether an interpretation also holds across the broader material.
Asking a Question to a Relevant Subset
Working with a smaller, analytically meaningful subset can increase the level of detail in the response and make comparisons easier to interpret.
The main advantages are:
Greater analytical focus: The response is based only on the selected cases, making it easier to examine issues that are relevant to a particular subgroup or comparison.
More detail: With fewer documents included, individual differences, nuances, and contextual information are less likely to be compressed into a broad synthesis.
Clearer comparison: Patterns within and between subsets can be easier to identify, especially when the subsets are based on meaningful characteristics such as age, gender, role, location, stakeholder group, or another relevant profile variable.
Subsets should be defined for an analytical reason rather than simply to reduce the amount of data. For example, you might compare two stakeholder groups, examine only participants with a particular experience, or explore whether an interpretation differs across demographic or contextual characteristics.
Selecting a Relevant Subset
Use profile variables in QInsights to create analytically meaningful subsets of your data. These may be based on characteristics such as demographics, stakeholder group, data source, location, time of data collection, or other variables relevant to your research question (see Create Profiles for details).
This allows you set a specific profile as filter (see Working with Filters).
Once a subset has been selected, continue the analysis dialogically. Start with a broader question to establish an initial understanding, then use follow-up questions to examine specific patterns, differences, contradictions, or unexpected findings in more depth.
This allows you to move between broader synthesis and more focused analysis without losing sight of the context of individual cases.
Comparing Subsets
Repeat the analysis for each relevant subset using the same or comparable questions. This makes it easier to examine similarities, differences, recurring patterns, and contrasts across groups.
For a more systematic comparison, you can export the analyses for the individual subsets and add these exports back to the project as new files. The subset analyses can then be selected together in Conversational Analysis or Grid Analysis and compared directly.
When doing this, make clear in your prompt that the selected files contain previous analytical outputs rather than original source data. If you also want the comparison to remain grounded in the underlying data, select the original source files as references as well and state this explicitly in the prompt.
For example: “Compare the analyses of the different subsets and identify similarities, differences, and contradictions. Use the original source files as references to check and substantiate the comparison.”
Conversing with your AI Assistant Through Questions
Below you will find a list of questions for various purposes. Choose the approach that best suits your project’s needs. The examples below are designed to inspire and guide you in crafting your own tailored questions for deeper and more effective analysis.
Example Follow-Up Questions
Follow-up questions allow you to deepen your understanding of specific topics or explore nuances in the data. Here are examples to inspire your tailored questions:
- I would like to explore more about [Topic X]. Please provide more detailed insights on the following: [Specific question or area].
- Extract a quote that supports [Topic X].
- Give me an example quote from [Respondent Name(s)] that supports [Topic X].
- What are the differences between the respondents?
- Let’s focus on the similarities now. Which respondents expressed similar perspectives or had similar experiences regarding [Topic X]?
- How do respondents’ views on [Topic X] evolve over the course of the interview? Please summarize any changes in perspective.
- Can you identify underlying motivations or reasons behind respondents' views on [Topic X]?
- What additional nuances did respondents share about [Topic X] that might not have been fully explored?
- How do respondents’ emotions or tone change when discussing [Topic X], and what does this suggest about their perspectives?
- Are there any contradictions or tensions between different responses?
Creating Overview Tables
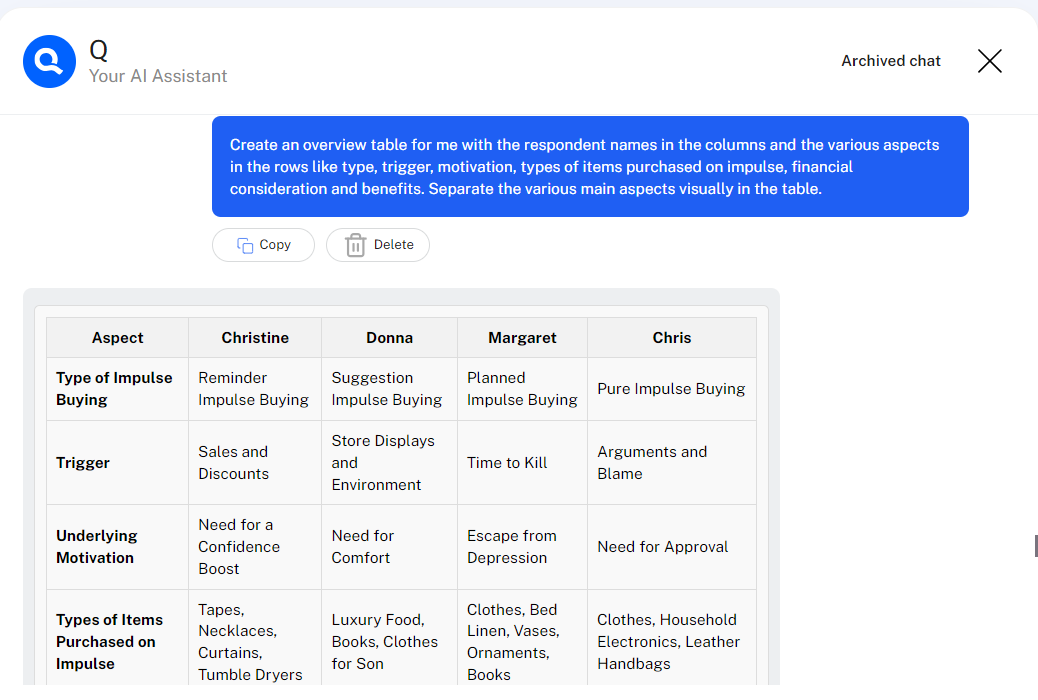
When comparing multiple responses, requesting an overview table is helpful for visualizing variations and commonalities in the data. You can customize the table to suit your analysis:
- Create a table with respondent names in the columns across the top, and the [various perspectives/experiences/opinions on Topic X] in the rows.
- In the cells of the table, indicate with an X if [Topic X] was mentioned.
- In the cells of the table, include a supporting quote if [Topic X] is applicable to the respondent.
- In the cells of the table, [specify what you want to see, e.g., themes, keywords, or sentiment].
Analytic Questions
Analytic questions move the analysis from description toward interpretation by exploring relationships, patterns, and dependencies in the data. Below are several types of analytic questions, together with examples.
Relational Questions: Highlight connections between elements
- What are the relationships between participant attitudes and their stated values?
- How does trust influence decision-making across respondents?
Comparative Questions: Focus on similarities and differences
- How do participants from different groups perceive Topic X?
- What are the similarities and differences in participants' approaches to Challenge Y?
Correlative Questions: Explore associations
- How does the frequency of emotional language relate to levels of satisfaction?
- Is there a link between years of experience and leadership style?
Pattern-Seeking Questions: Examines causes and effects or influencing factors
- What patterns emerge in respondents' views on Topic X across demographics?
- Do respondents consistently mention certain benefits when discussing [specific topic]?
Causal Questions: Examine causes and effects or influencing factors
- What factors seem to influence respondents' attitudes toward Z?
- What drives participants to adopt Strategy Y?
Conceptual Linkage Questions: Identifies conceptual or thematic relationships
- What links exist between the concepts of collaboration and innovation?
- I’ve noticed a relationship between [Aspect A] and [Aspect B]. Verify if this exists across the dataset and describe how it is expressed.
Dependency Questions: Focus on hierarchies or dependencies
- How do participants’ experiences depend on external factors such as resource availability?
- Which respondents’ perspectives shift based on specific variables (e.g., age, gender, or education)?
Validating Your Synthesis
You can also validate the synthesis that you have written. Open a new chat and paste your write-up into the entry field, using the following prompt:
- Here is my synthesis on [Topic]. Please check the accuracy of the data, review the flow of reasoning, and ensure that nothing important is missing. Correct any spelling errors, improve sentence structure, and include a quote from each respondent if not already provided
The result can serve as a building block for your report, so be sure to save it with an appropriate name in the project archive.
Relating Findings to Theory
Another option is to relate your findings to existing theories. If the theory you're working with is well-established, Q is likely familiar with it. However, it's a good idea to verify this first by asking:
- Are you familiar with [Theory X]? If so, provide a detailed description, including its key concepts.
If Q is unfamiliar, provide context:
- Here is a brief description of [Theory X] and its important concepts: [Insert Description]. Based on this theory, how can it help explain [specific findings or relationships]?
Identifying relationships
You can allow Q to take more initiative by asking it to identify relationships in the data. While it’s important to be aware that the results may reflect patterns from its training data, this approach can often reveal new insights or highlight connections you might not have noticed. It can be an inspiring way to explore your data with fresh perspectives; just be sure to reflect critically on the findings as you incorporate them.
To maintain context, start by summarizing what you and Q have already identified in previous chats. This way, Q continues from the established discussion instead of starting a completely new analysis. Once you've provided the summary, you can ask:
In Conversational Analysis, you can now also ask Q to visualize the identified relations (see Creating Visualizations in Chat).