
Data Context helps you define how QInsights should understand and organise your data before analysis. It allows you to assign speaker roles, create characteristics for speakers or documents, and enter the corresponding values.
Why Data Context matters
Adding context improves the quality of analysis. It helps QInsights distinguish between evidence and framing, interpret responses in relation to speaker or document characteristics, and support comparisons across groups or data sources.
Data Context is particularly useful when:
- you work with interviews or focus groups involving multiple speakers,
- you want to compare responses across participant groups,
- you analyse mixed datasets from different sources,
- or you work with larger datasets and need structured filtering options.
Define Speaker Roles
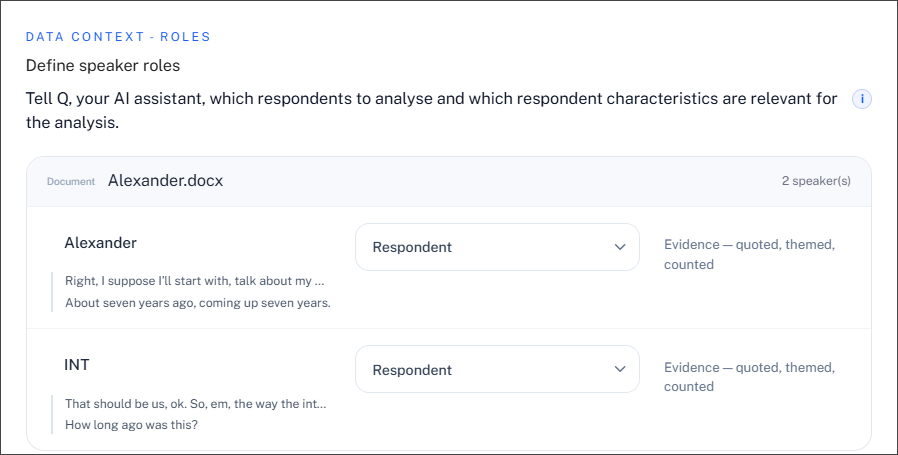
In the Roles section, you assign a role to each speaker in a document. This helps QInsights interpret contributions correctly during analysis. For interview and focus group data, this distinction is especially important. Contributions from respondents are treated as analytic evidence and can be quoted. Contributions from interviewers or moderators are treated as contextual material that frames the conversation but is not analysed as data.
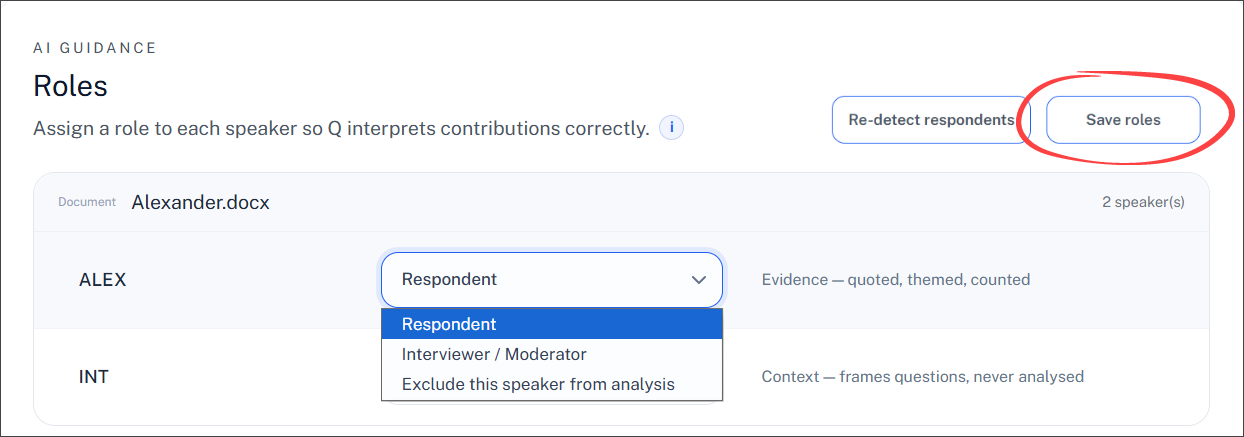
Three roles are available:
- Respondent — the speaker's text is treated as primary data and is available for quoting, theming, and counting.
- Interviewer / Moderator — the speaker's text is retained as contextual background but is not analysed as data.
- Exclude — the speaker's contributions are removed from analysis entirely. This is useful for, say, a brief exchange with someone who walked into the room mid-recording.
To assign speaker roles
- For each document, review the listed speakers. The first two lines of a speaker utterance is shown to make it easier to recognize who is a respondent and who is the interviewer /moderator if generic speaker IDs are used.
- Use the dropdown menu next to each speaker name to assign the correct role.
- Click Save roles.
Create Profiles
In the Profiles section, you define the characteristics you want to use for speakers or documents. A profile can be applied either to a speaker or to a document and can have one of three data types: Text / Number / Boolean (see details below).
Examples of document profiles include source, document type, year, location, organisation, or project.
Examples of speaker profiles include age, gender, profession, role, affiliation, stakeholder group, or interview experience.
To create a profile:
- Select the Profiles tab.
- Click Add Characteristic.
- Enter a name for the characteristic.
- Select the Type: Text / Number / Boolean (see explanation below).
- In the column Applies to, select whether the characteristic belongs to a Speaker or a Document.
- Click Save.
Data types
Text: Use for categories or labels such as gender, department, role, source, or country.
Number: Use for numeric values such as age, year, income, or score.
Boolean: Use for values with two possible states, such as yes/no, true/false, or present/not present.
Examples of document profile characteristics: Source / Document type / Year / Country / Organisation / Department /Project phase
Examples of speaker profile characteristics: Age / Gender / Role / Profession / Affiliation / Stakeholder group / Level of experience
Adding Values to Document or Respondent Characteristics
In the Values section, you enter the actual values for the profiles you created. This is where you specify, for example, that a respondent is 34 years old, works in healthcare, and belongs to a particular stakeholder group, or that a document comes from a certain country, year, or source. These values make it possible to compare groups, focus on subsets of data, and conduct more targeted analysis.
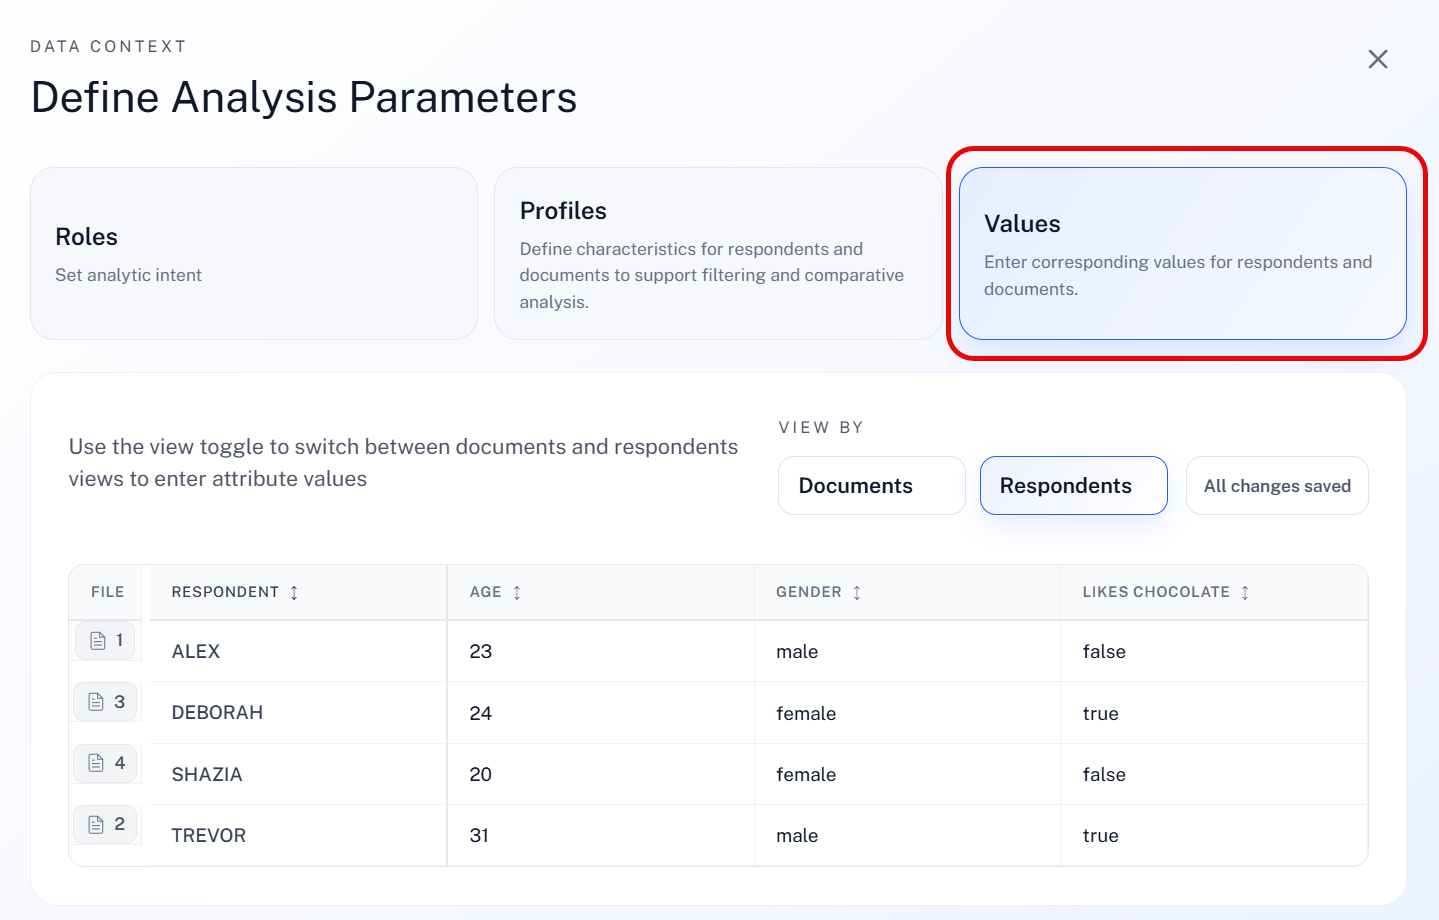
You can switch between Documents and Respondents view, depending on whether the profile applies to documents or speakers.
To enter values:
- Select the Values tab.
- Choose the appropriate view:
- Documents for document-level profiles
- Respondents for speaker-level profiles
- Locate the document or respondent in the table.
- Enter the relevant values in the corresponding columns.
- Repeat this for all relevant rows.
Changes are saved automatically once entered.
Import Profile Data from Excel
If profile information for your speakers or documents is already available in a spreadsheet, you can import it rather than creating and assigning each characteristic manually.
This import is intended for metadata or profile information—for example, age, gender, region, organisation, document type, or source. It is different from adding an Excel file that contains qualitative survey responses for analysis.
The import process consists of five steps:
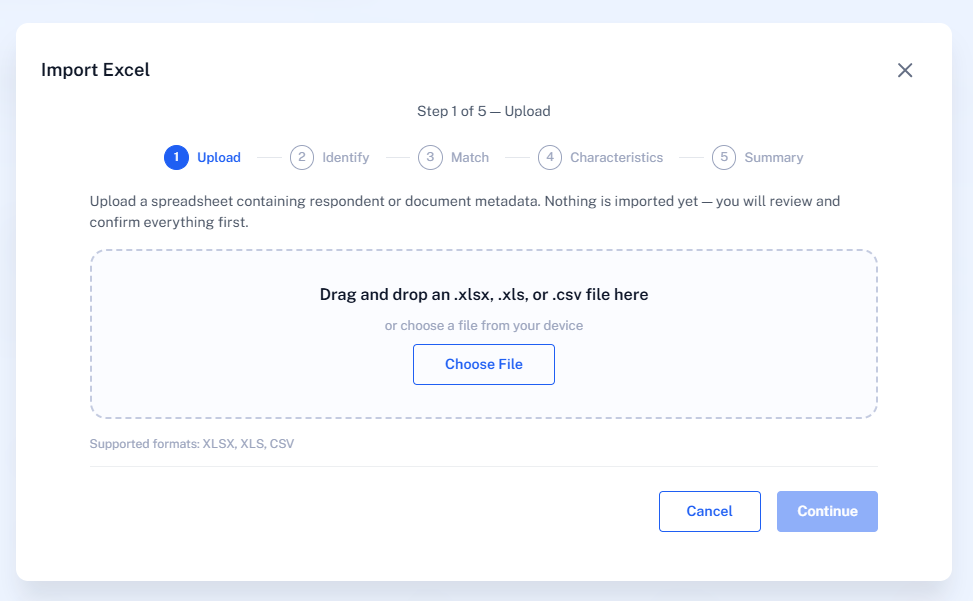
1. Upload
- Upload the spreadsheet containing the profile information. Supported formats are XLSX, XLS, and CSV.
At this stage, no data are imported. You can review and confirm the information in the following steps before any changes are made.
2. Identify
Select whether each row in the spreadsheet represents a Document or a Respondent:
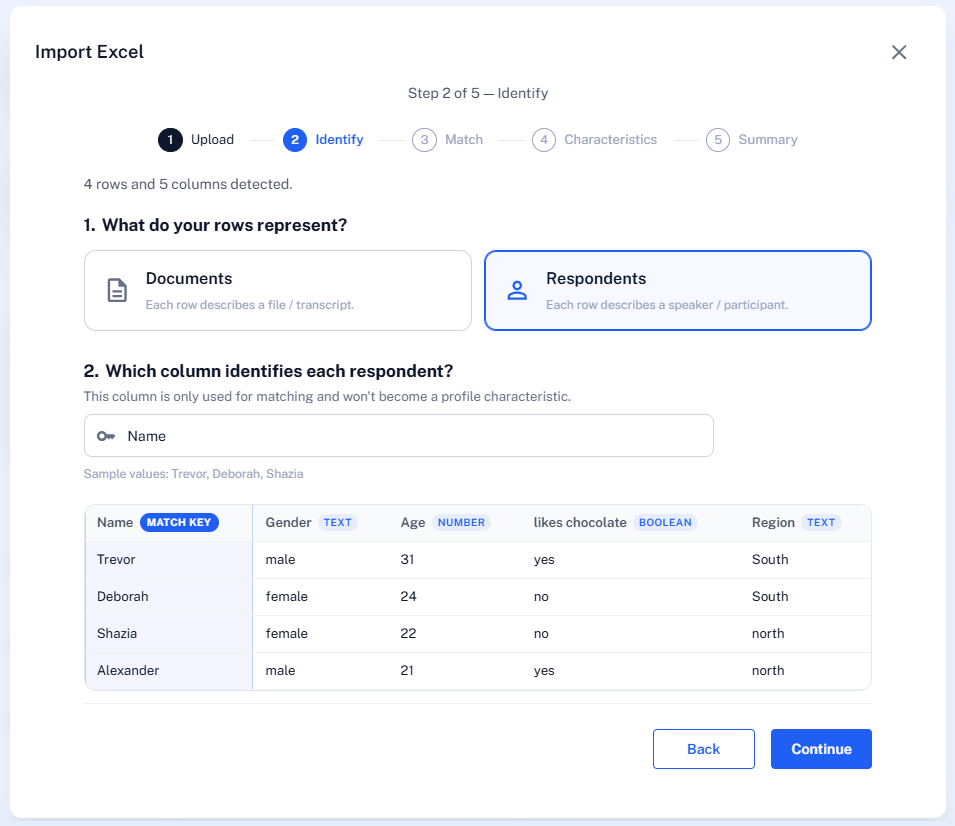
Next, select the column that contains the corresponding document name or respondent name. This column is used as the matching key to connect each spreadsheet row with the correct document or respondent already in the project.
- Click Continue to move to step 3.
3. Match
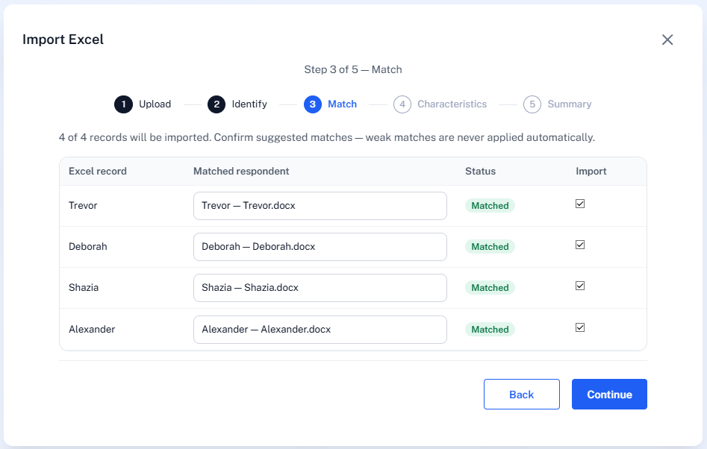
The next screen shows how the records in the spreadsheet have been matched to existing documents or respondents in the project.
Review the suggested matches before continuing. Matches that cannot be established with sufficient confidence are not applied automatically and can be reviewed or excluded from the import. Or you can cancel the process and make adjustments to the Excel file.
- If everything is matched as it should be, click Continue.
4. Characteristics
The remaining spreadsheet columns are treated as potential profile characteristics. Before importing them, review how each column will be handled.
For each characteristic, you can:
- change its name;
- define or correct its type as Text, Number, or Boolean;
- specify whether it applies to a Respondent/Speaker or Document;
- exclude a column that you do not want to import.
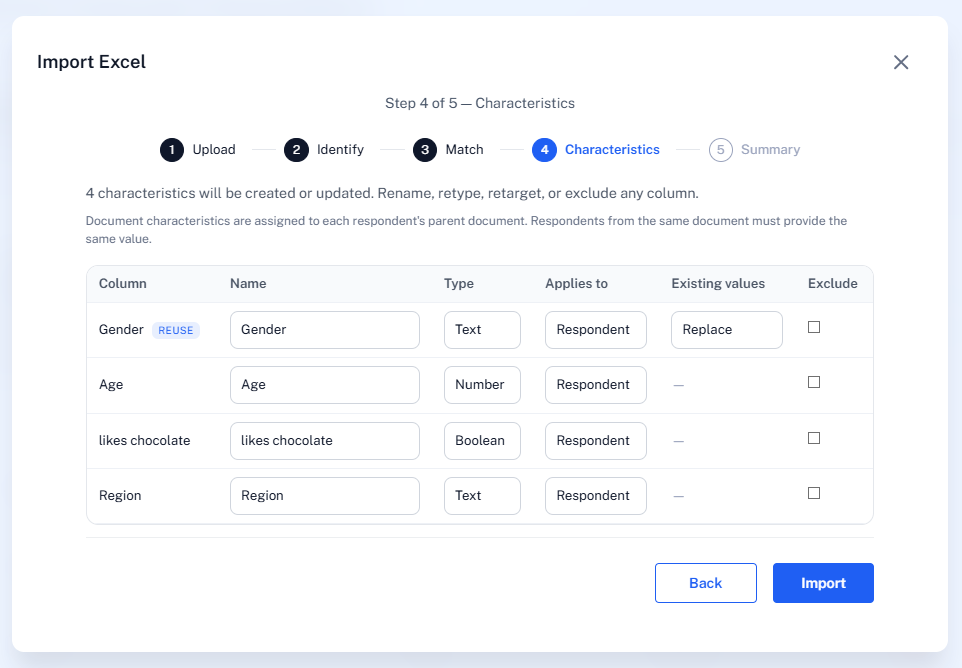
If a characteristic with the same name already exists, the existing characteristic can be reused rather than creating a duplicate. Review how existing values should be handled before completing the import.
- Click Import once the characteristics have been configured.
5. Complete
The imported characteristics and values are then available in the Data Context for filtering, comparison, and subgroup analysis.
- Click Done to return to the Data Context window.
Making Use of Respondent & Document Profiles
Profile data gives QInsights important context about your documents and respondents. The AI assistant can take this information into account during analysis, even when no filter is set. For example, you can ask directly about differences by gender, role, department, or any other profile characteristic included in your data context.
Filters are therefore not required in order to analyse group differences. Their main purpose of using filters is to create subsets of the data and reduce the scope of analysis when this is helpful.
Working with subsets can be useful when datasets are larger or more diverse. If too much data is analysed at once, answers may become more general, nuanced differences may receive less attention, and some aspects of the data may be flattened or left out. In addition, very large outputs can become harder to review and interpret.
Using filters allows you to focus on a selected part of the data, for example one respondent group, one department, one region, or one document type. This can make the analysis more manageable and help you examine patterns in greater depth. In practice, it is often easier to work step by step with smaller, meaningful subsets than to analyse a very large volume of data all at once. See also Querying All Data vs. Subsets: Striking the right balance in analysis.